Course Content
MARKET ORGANIZATION AND STRUCTURE
This chapter is covered in Reading 36 of Study Session 12 of the institute. After reading this chapter, the candidate should be able to: a. explain the main functions of the financial system; b. describe classifications of assets and markets; c. describe the major types of securities, currencies, contracts, commodities, and real assets that trade in organized markets, including their distinguishing characteristics and major subtypes; d. describe types of financial intermediaries and services that they provide; e. compare positions an investor can take in an asset; f. calculate and interpret the leverage ratio, the rate of return on a margin transaction, and the security price at which the investor would receive a margin call; g. compare execution, validity, and clearing instructions; h. compare market orders with limit orders; i. define primary and secondary markets and explain how secondary markets support primary markets; j. describe how securities, contracts, and currencies are traded in quote-driven, order-driven, and brokered markets; k. describe characteristics of a well-functioning financial system; l. describe objectives of market regulation.
0/11
SECURITY MARKET INDEXES
This chapter is covered in Reading 37, of Study Session 12 of the material provided by the institute. After reading this chapter, a student should be able to: a. describe a security market index; b. calculate and interpret the value, price return, and total return of an index; c. describe the choices and issues in index construction and management; d. compare the different weighting methods used in index construction; e. calculate and analyze the value and return of an index given its weighting method; f. describe rebalancing and reconstitution of an index; g. describe uses of security market indices; h. describe types of equity indices; i. describe types of fixed-income indices; j. describe indices representing alternative investments; k. compare types of security market indices.
0/9
MARKET EFFICIENCY
This chapter is covered in Reading 38, of Study Session 12 of the material provided by the institute. After reading this chapter, a student should be able to: a. describe market efficiency and related concepts, including their importance to investment practitioners; b. distinguish between market value and intrinsic value; c. explain factors that affect a market’s efficiency; d. contrast weak-form, semi-strong-form, and strong-form market efficiency; e. explain the implications of each form of market efficiency for fundamental analysis, technical analysis, and the choice between active and passive portfolio management; f. describe market anomalies; g. describe behavioral finance and its potential relevance to understanding market anomalies.
0/6
OVERVIEW OF EQUITY SECURITIES
This topic is covered in the reading 39 of study session 13 of the study material provided by the institute. After reading this chapter a student should be able to: a. describe characteristics of types of equity securities; b. describe differences in voting rights and other ownership characteristics among different equity classes; c. distinguish between public and private equity securities; d. describe methods for investing in non-domestic equity securities; e. compare the risk and return characteristics of different types of equity securities; f. explain the role of equity securities in the financing of a company’s assets; g. distinguish between the market value and book value of equity securities; h. compare a company’s cost of equity, its (accounting) return on equity, and investors’ required rates of return.
0/7
INTRODUCTION TO INDUSTRY AND COMPANY ANALYSIS
This topic is covered in reading 40 of study session 13 of the study material provided by the institute. After reading this chapter a student should be able to: a. explain uses of industry analysis and the relation of industry analysis to company analysis; b. compare methods by which companies can be grouped, current industry classification systems, and classify a company, given a description of its activities and the classification system; c. explain the factors that affect the sensitivity of a company to the business cycle and the uses and limitations of industry and company descriptors such as “growth,” “defensive,” and “cyclical”; d. explain how a company’s industry classification can be used to identify a potential “peer group” for equity valuation; e. describe the elements that need to be covered in a thorough industry analysis; f. describe the principles of strategic analysis of an industry; g. explain the effects of barriers to entry, industry concentration, industry capacity, and market share stability on pricing power and price competition; h. describe industry life cycle models, classify an industry as to life cycle stage, and describe limitations of the life-cycle concept in forecasting industry performance; i. compare characteristics of representative industries from the various economic sectors; j. describe macroeconomic, technological, demographic, governmental, and social influences on industry growth, profitability, and risk; k. describe the elements that should be covered in thorough company analysis.
0/9
EQUITY VALUATION: CONCEPTS AND BASIC TOOLS
This topic is covered in reading 41 of study session 13 of the study material provided by the institute. After reading this chapter a student should be able to: a evaluate whether security, given its current market price and a value estimate, is overvalued, fairly valued, or undervalued by the market; b describe major categories of equity valuation models; c describe regular cash dividends, extra dividends, stock dividends, stock splits, reverse stock splits, and share repurchases; d describe dividend payment chronology; e explain the rationale for using present value models to value equity and describe the dividend discount and free-cash-flow-to-equity models; f calculate the intrinsic value of a non-callable, non-convertible preferred stock; g calculate and interpret the intrinsic value of equity security based on the Gordon (constant) growth dividend discount model or a two-stage dividend discount model, as appropriate; h identify characteristics of companies for which the constant growth or a multistage dividend discount model is appropriate; i explain the rationale for using price multiples to value equity, how the price to earnings multiple relates to fundamentals, and the use of multiples based on comparables; j calculate and interpret the following multiples: price to earnings, price to an estimate of operating cash flow, price to sales, and price to book value; k describe enterprise value multiples and their use in estimating equity value; l describe asset-based valuation models and their use in estimating equity value; m explain the advantages and disadvantages of each category of the valuation model.
0/12
Equity Investments
About Lesson

Gordon Growth Model

a.  Gordon’s growth model is similar to the basic dividend discount model, except that it has the provisions for the growth in dividends.

b.  This model is also called the two-stage dividend discount model. This model allows for the growth or change of dividend over time.

c.  This model assumes that dividends grow indefinitely at a constant growth rate. Thus, this model is most appropriate for the non-cyclical and matured companies, as these companies have fairly stabilized and constant growth.

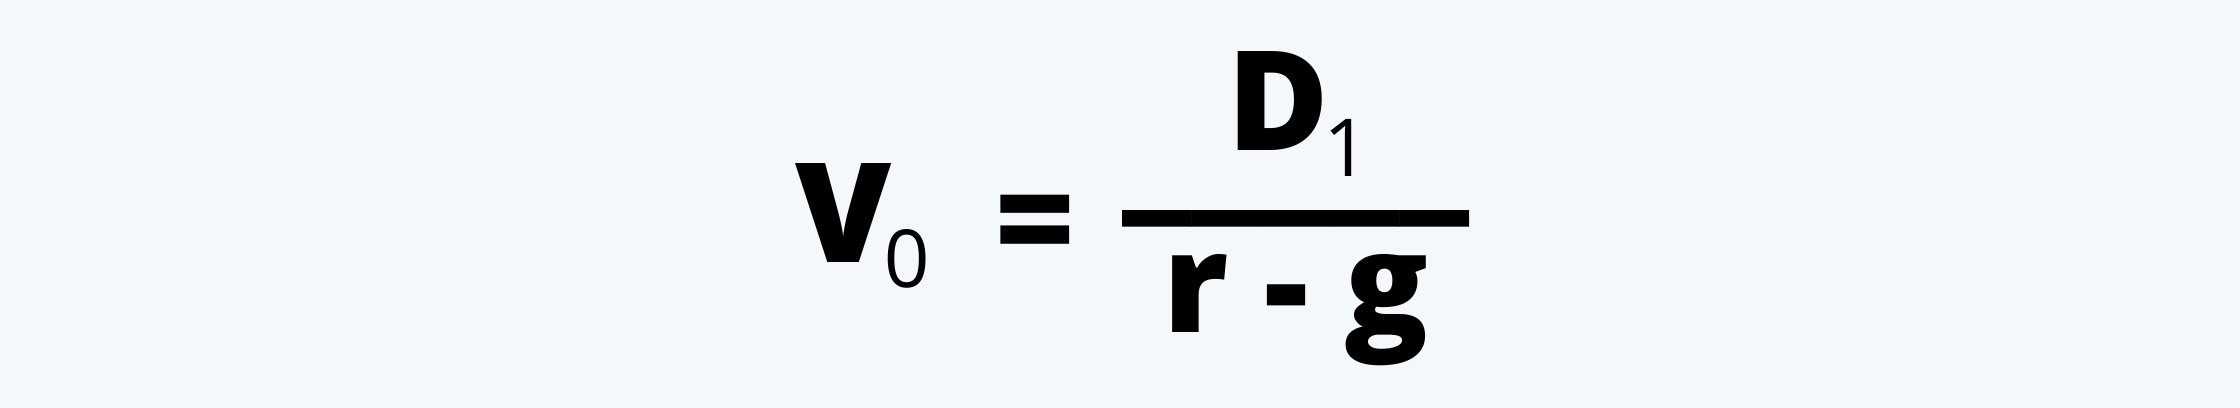
d.  The intrinsic value of the company as per the Gordon Growth Model is:

Gordon Growth Model Formula Equity Investment CFA Level 1 Study Notes

Another assumption of this model is that the ‘r’, i.e. the required rate of return is always higher than ‘g’, i.e. the growth rate of dividends.
Also, as per this model:

Equity Investment CFA Level 1 Study Notes

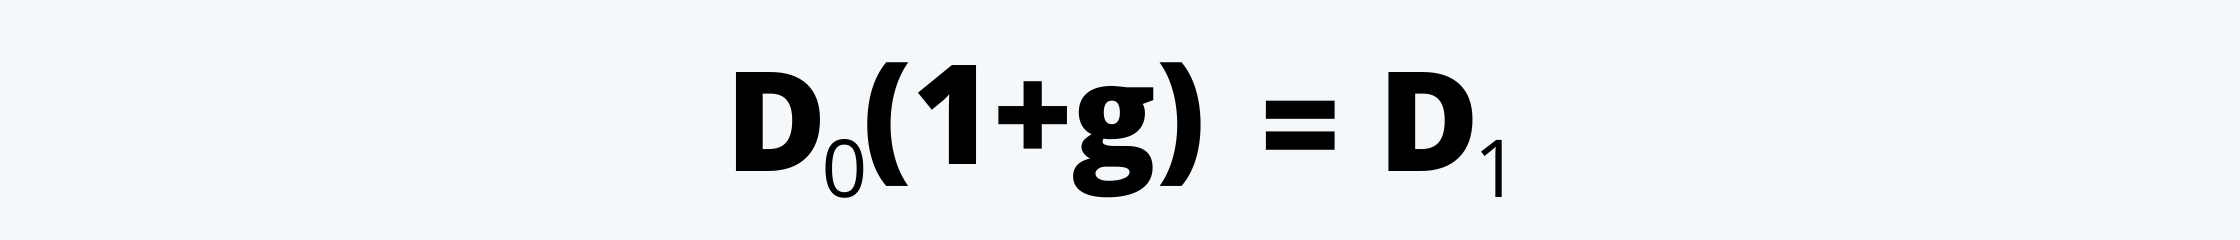
D1 is the dividend in the next period.
Therefore,

Gordon Growth Model Formula Equation Equity Investment CFA Level 1 Study Notes

e.  The growth rate of dividend, i.e. ‘g’ is nothing but the ‘earnings retention rate’ times the ‘return on equity’.

earning retention rate Equity Investment CFA Level 1 Study Notes

Where,

b          = earnings retention rate, or (1-DPR)
            DPR is the dividend payout ratio

ROE    = Return on Equity

Alternatively, the analysts can also use the historical trends data or the median industry dividend growth rate to estimate the growth.

f.  The Gordon Growth Model is extremely sensitive to the changes in both r and g.

g.  In this model, as the ‘r’ approaches ‘g’ the intrinsic value of the stock increases dramatically; hence, the basic requirement of this model is that the ‘g’ must be strictly lower than the ‘r’.

h.  Thus, some of the main assumptions of this model are:

     i.  The dividends are the correct metric for valuation purposes;

    ii.  The ‘g’, i.e. the growth rate of dividend is constant and perpetual and it never changes;

   iii.  The required rate of return, i.e. ‘r’ is also constant over time; and

   iv.  The ‘g’ is significantly less than ‘r’.

i.  Some of the main alternatives to using the Gordon Growth Model are:

     i.  Modifying the model for the varying pattern of growth;

    ii.  Using cash flow as a measure rather than dividends, especially for the non-dividend paying stocks; and

   iii.  Using some other approach.

For Example:

Suppose there is a stock, which is currently paying a dividend at $ 1 per year per share. This dividend is expected to grow at the rate of 4% per annum, infinitely. The required rate of return of the stock is 6%. We have to calculate the intrinsic value of the stock.

We are given the following information:

Particulars

Value

D0

$ 1

G

4%

R

6%

The intrinsic value of the stock would be:
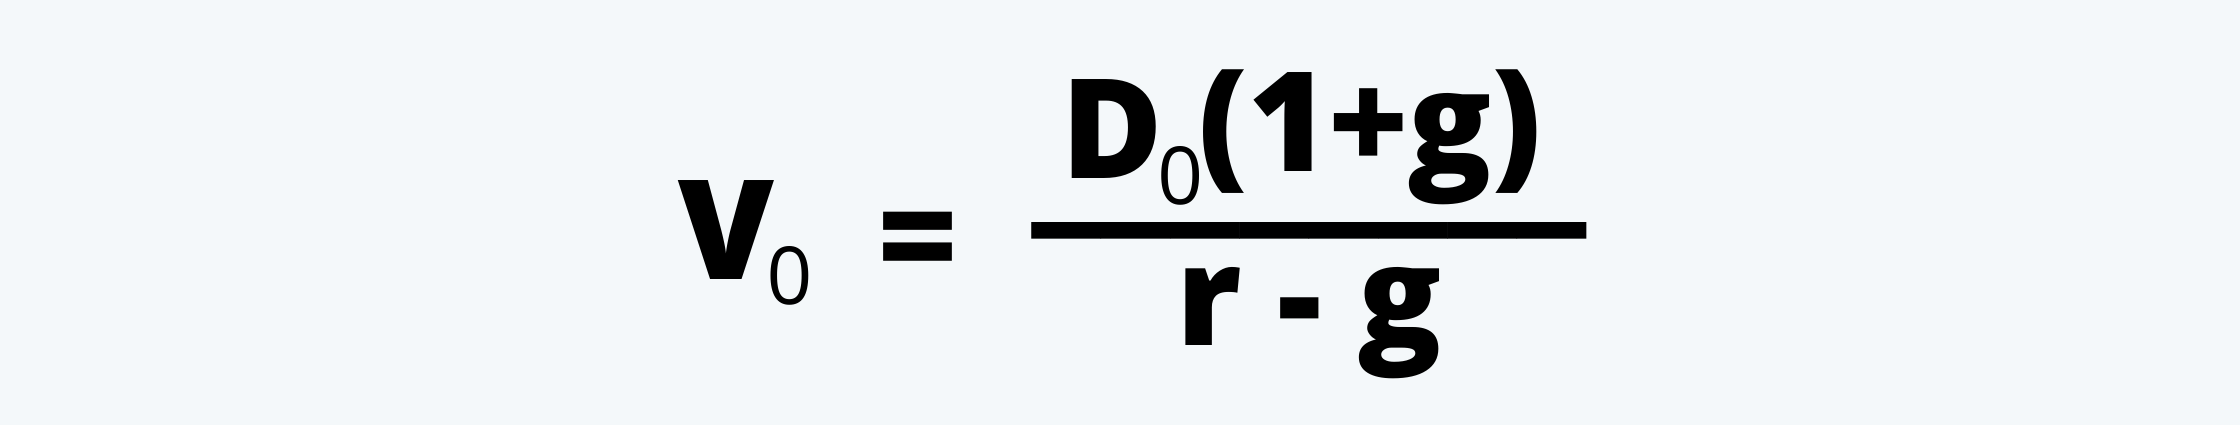
Gordon Growth Model Formula Equity Investment CFA Level 1 Study Notes

or,

V0 = [1(1 + 0.04)] / [0.06 – 0.04] = $52