LOS A requires us to:
describe tools and techniques used in financial analysis, including their uses and limitations.
The tools and techniques facilitate analysis by converting the financial statement data into useful formats. We will now discuss the above-mentioned tools and techniques in detail (including their uses and limitations).
1. Ratio Analysis
Ratios are an important tool that expresses the relationship among the data as a proportion or percentage that helps in internal comparison and comparison across the firms. These are just the indicators that provide information about what the situation is and not why the situation is. Thus the ratios are useful in identifying the questions that need to be answered rather than answering the same. Say, for example, the ratios can tell us about the liquidity position of two firms but it cannot explain the reasons for the difference in the same; for that, we need to dig into the other sources of information.
The main uses of ratios are:
a. making projections for the future,
b. highlighting the microeconomic relationships within a firm,
c. evaluating the degree of solvency, liquidity, and profitability of the firm,
d. evaluating and comparing the firm with respect to others in the industry, and
e. evaluating the management’s performance.
However, ratio analysis has certain limitations. They are:
a. Ratios in themselves are not a complete source of analysis as such; they need to be complemented with other information.
b. For comparison purposes, the ratios need to be adjusted for the differences in the accounting policies.
c. Comparing ratios of companies operating in different industries becomes difficult at times.
d. Finding the idle ratios is also a difficult task, as there is no single idle situation for all cases.
e. There are numerous ratios that can be calculated, but it is not the calculation that is important. It is the interpretation of these ratios that is the goal of the analysis.
2. Common-Sized Statements
a. As discussed in the previous chapters, the common-sized statements present all the items of a financial statement as a percentage of a common item, thus facilitating comparison.
b. There are two types of common-sized statements: vertical common-sized statements and horizontal common-sized statements.
c. In a vertical common-sized income statement every line item is expressed as a percentage of total revenues, whereas, in a vertical common-sized balance sheet everything is expressed as a percentage of total revenues. In a vertical common-sized cash flow statement everything is either expressed as a percentage of revenue or all the items on the inflow side are expressed as a percentage of total inflows and all the items on the outflow side as a percentage of total outflows.
d. In horizontal common-sized statements, there are figures for different years present. One year (usually the beginning year) is considered as the base year, and corresponding figures for the following years are expressed as a percentage of the base year.
e. The common-sized statements do not provide the complete information about the as-is situation of the company, but it does inform the analyst about the trends witnessed by the company.
3. Cross-Sectional Analysis
It is the analysis of the financial data of different companies that are compared across all the sections at a point in time.
4. Trend Analysis
Like under horizontal common-sized statements, in trend analysis also, a section of the financial information is presented as a percentage of the base year’s figure to identify the trends in that section.
Trend analysis also helps in future projections or making a forecast.
5. Graphical Analysis
a. In the graphical analysis, the financial data and the trends are presented in form of graphs, lines, charts, etc.
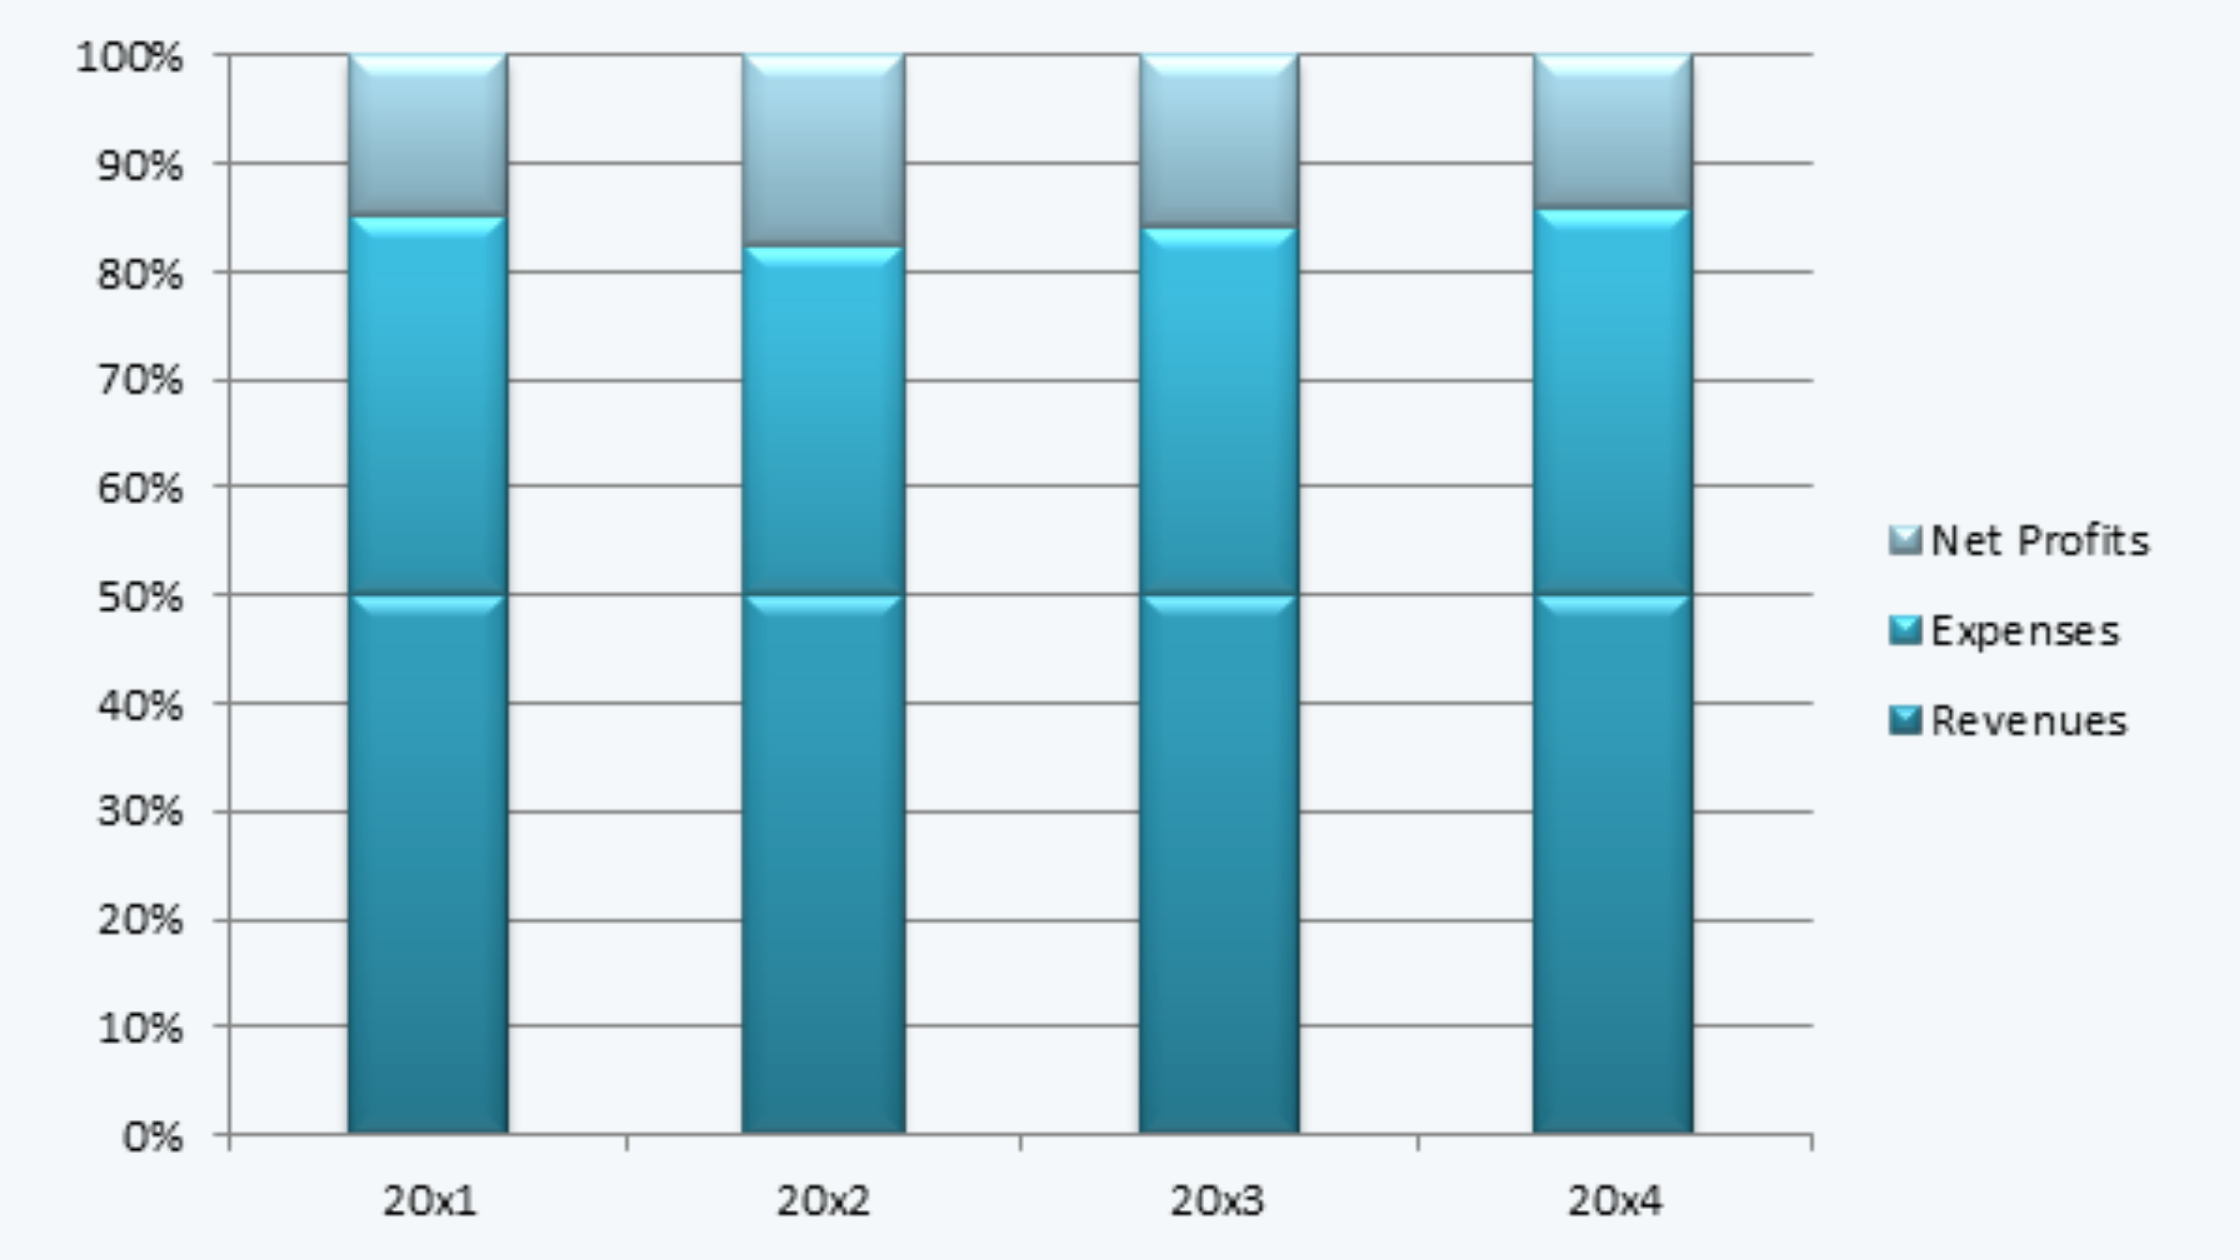
b. A stacked column graph presents the changes in items belonging to different periods in graphical form. The example of a stacked bar graph is as follows:
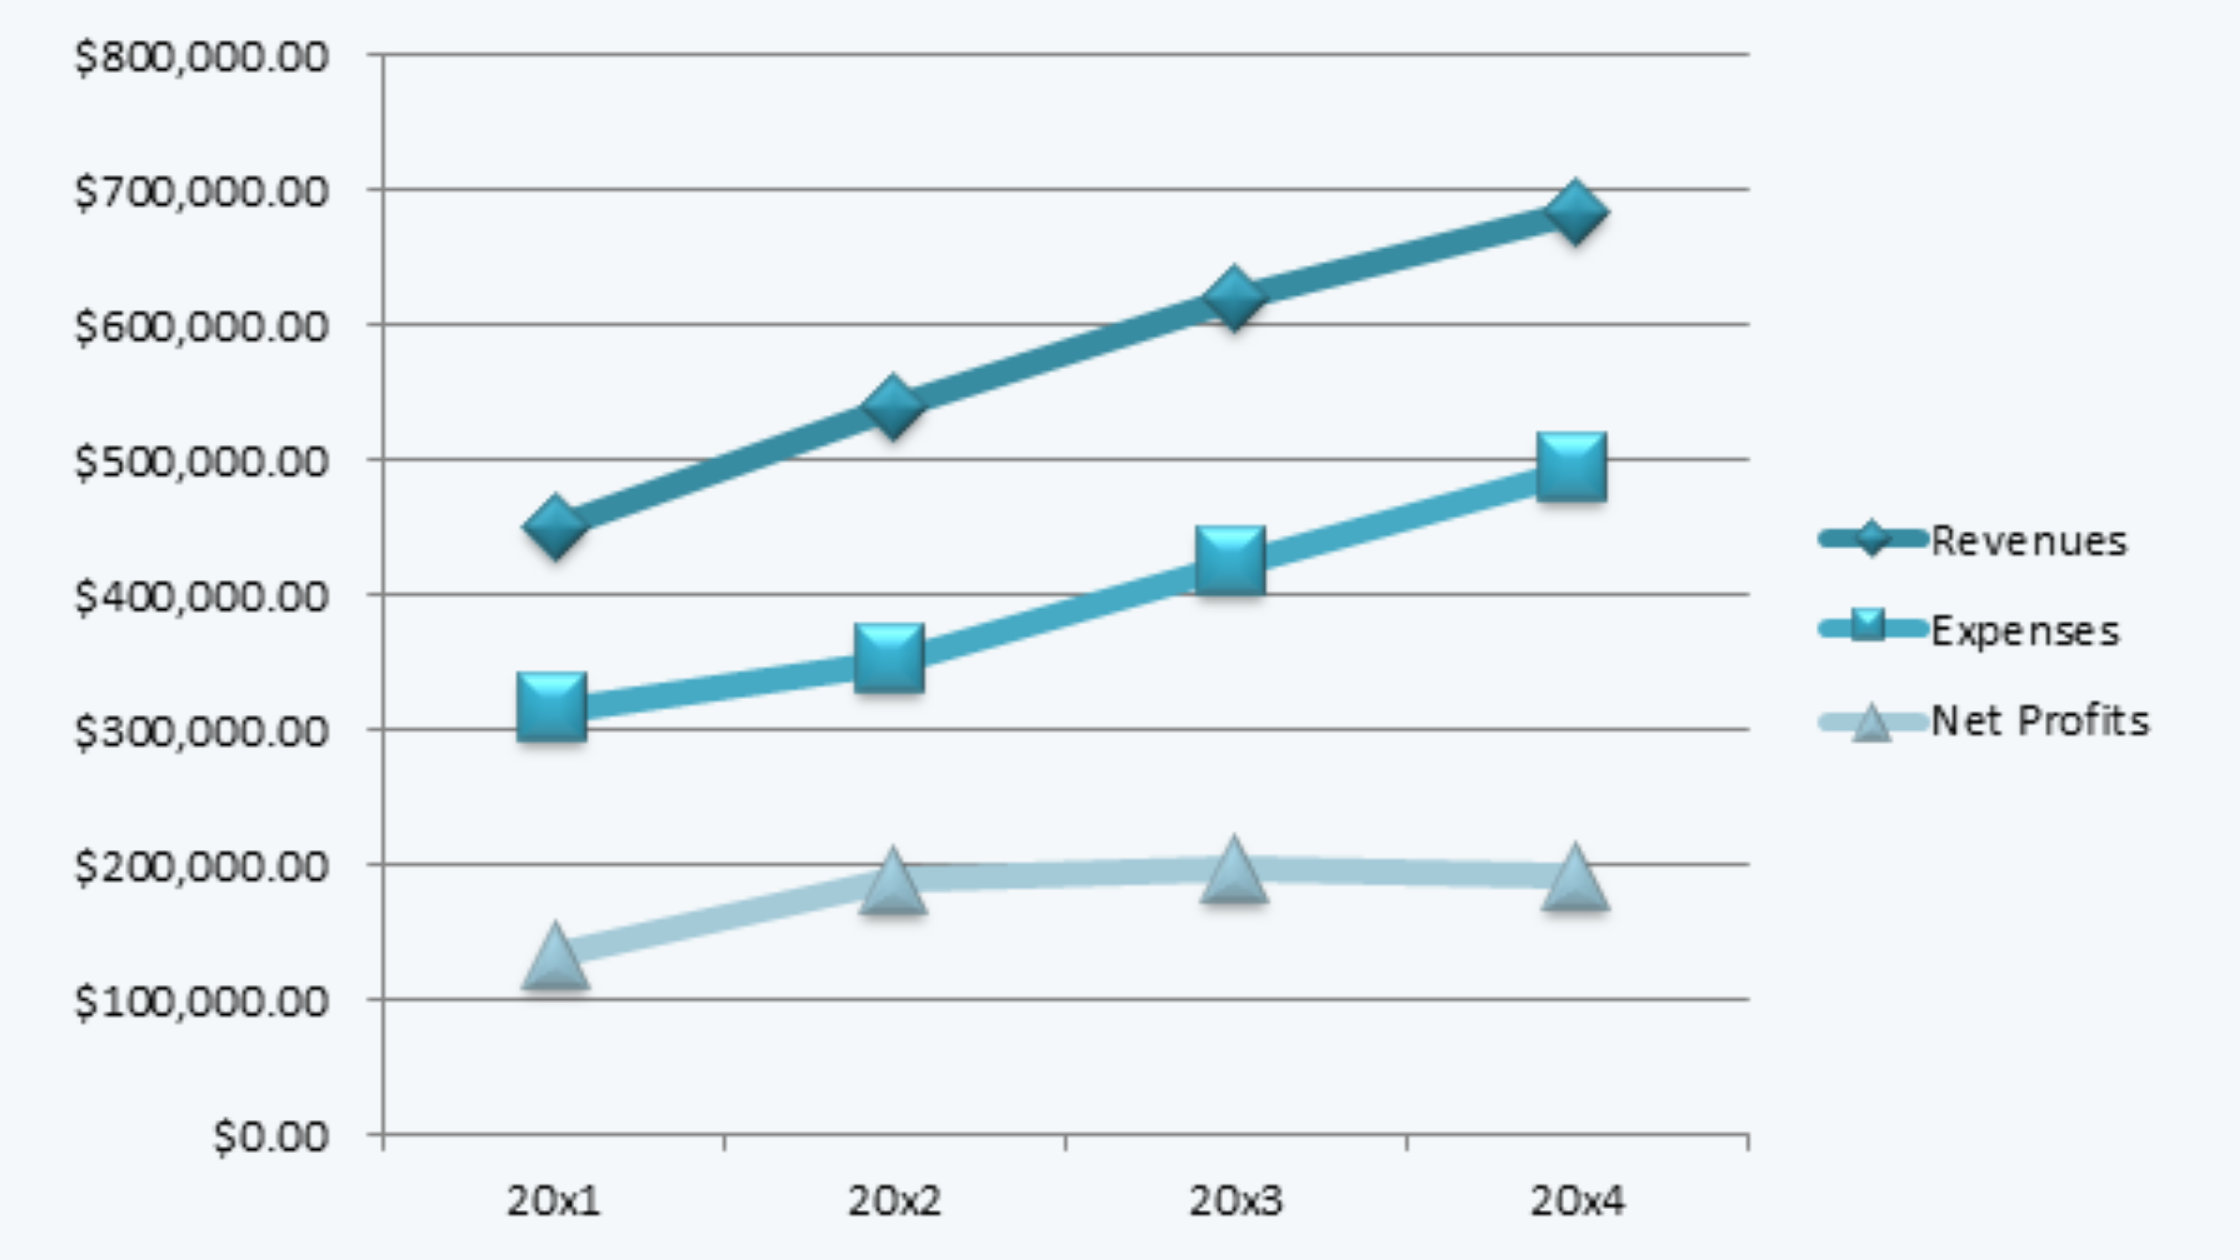
c. In a line graph, the data is presented in the form of lines instead of bars. The example of a line graph is:
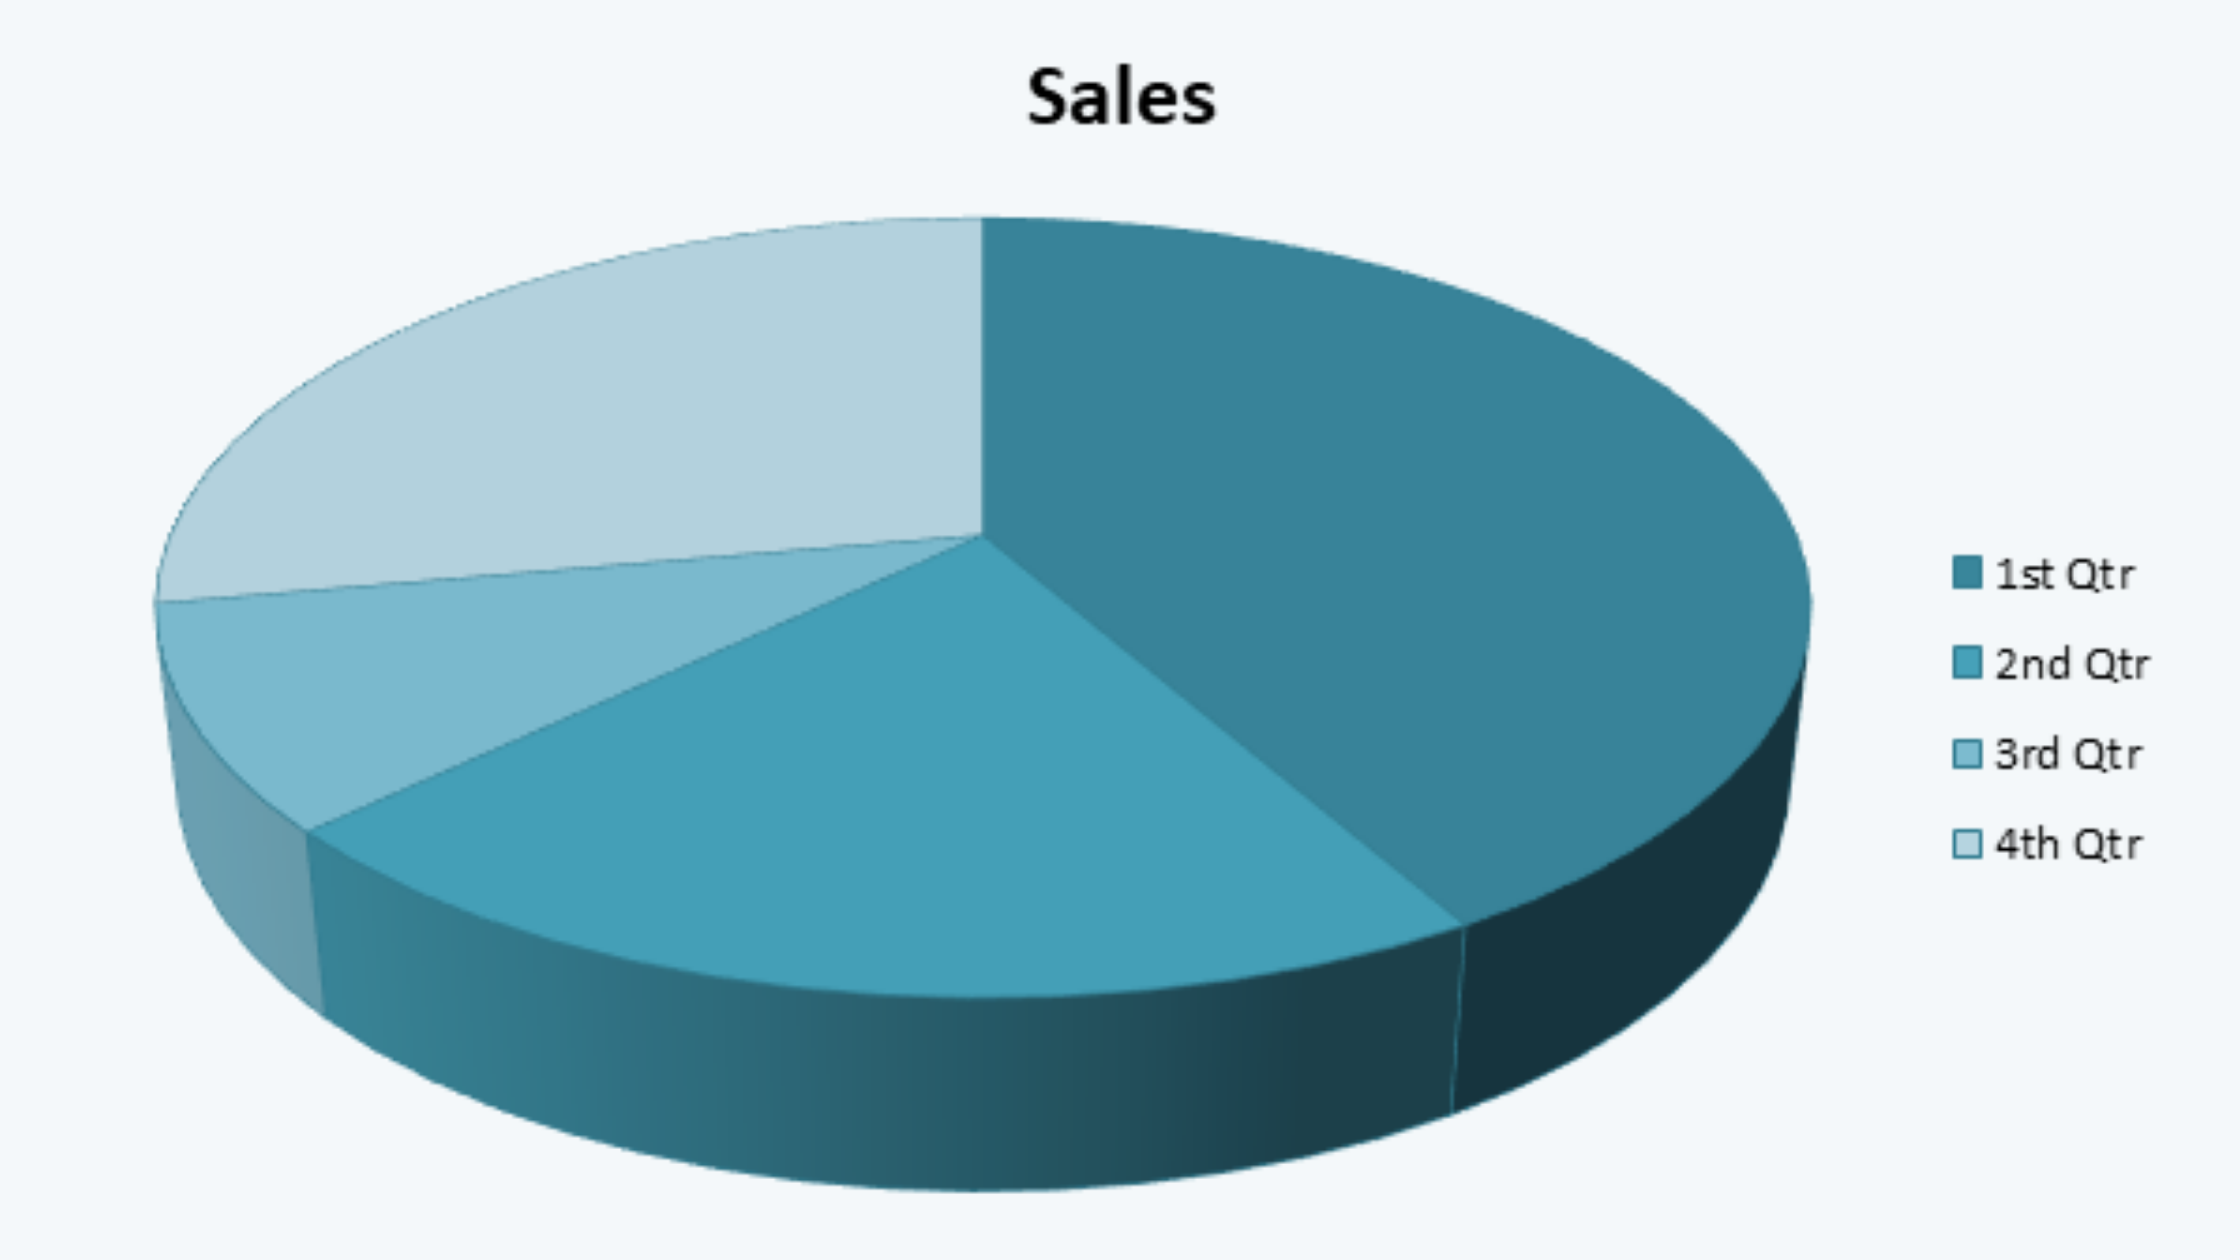
d. Then the data can also be presented in the form of a pie chart. It is a circular chart that presents the composition of a particular item. The example of a pie chart is:
6. Regression Analysis
Regression analysis can be used to identify relationships between two variables and make future projections based on such relationships. We can study regression analysis in detail in ‘quantitative methods’.