The marginal Cost of Capital (MCC) of a firm is the weighted average cost of each additional unit of capital raised by it. The MCC is usually depicted as an upward sloping curve, as follows:
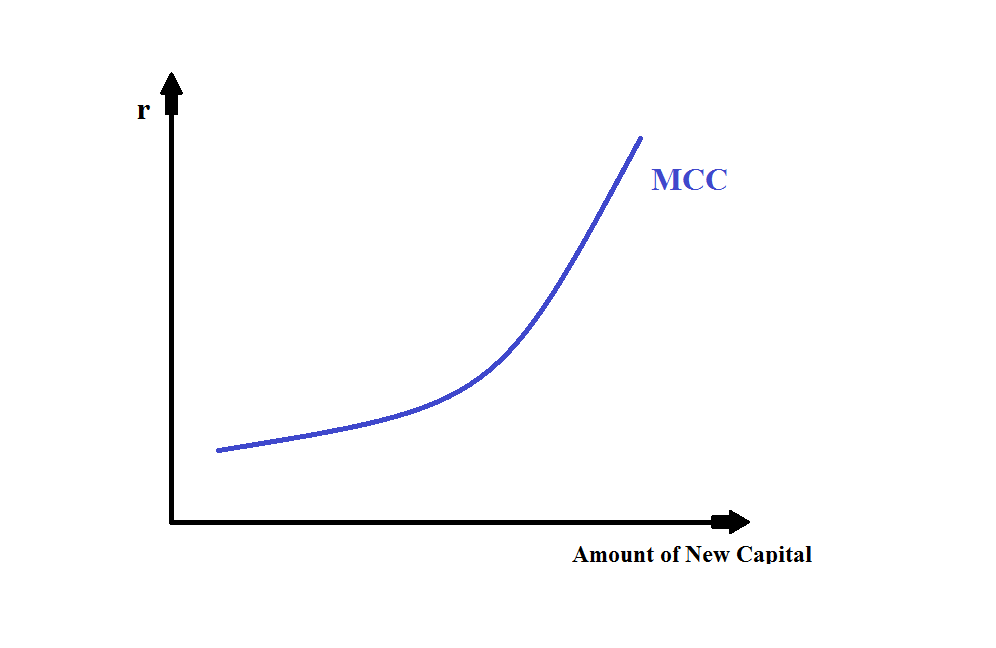
The reason, why the MCC curve is typically upward sloping is because the firm may not be able to issue debt at the same level of seniority based on one or more financial debt or conditions (also known as the debt incurrence test).
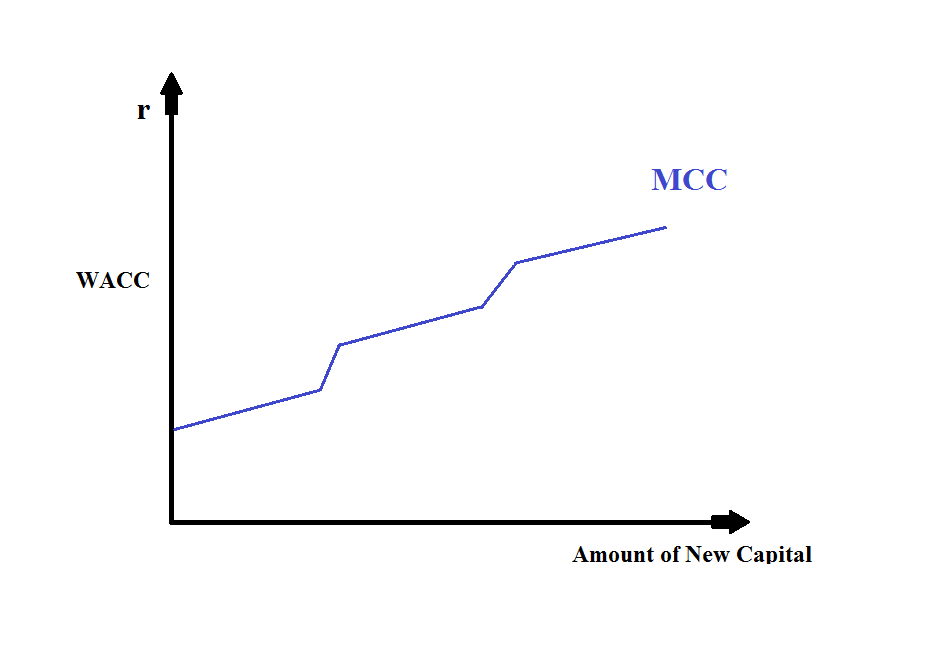
The upward-sloping MCC curve as above is more of a theoretical curve. A more realistic MCC would rather have break-points. A break-point is the amount of capital at which the weighted average cost of capital changes, creating steps in the MCC curve (as shown below):
For example:
Suppose a company that wants to raise capital (having a target debt-equity ratio of 40:60) have, following cost structure of capital:
|
New Debt |
r(1-t) |
New Equity |
R |
|
0-5 |
4% |
0-8 |
7% |
|
5-8 |
4.50% |
8-12 |
8% |
|
8-10 |
5% |
12-15 |
9% |
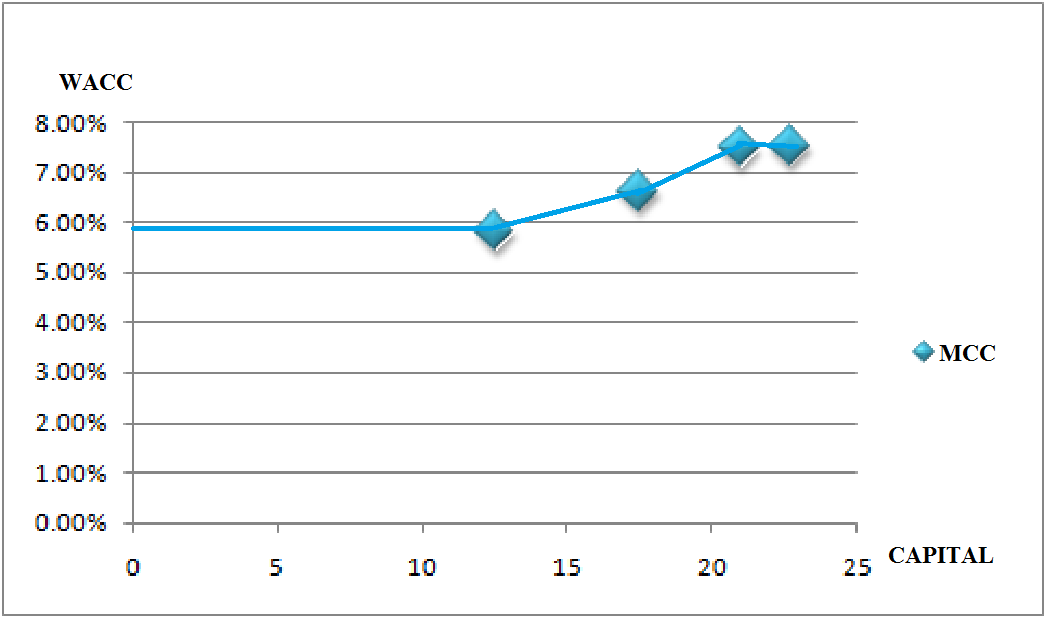
The company would have the following break-points, the amount of debt and equity funding, and the respective weighted average cost of capital:
|
Debt |
Equity |
Total |
WACC |
|
5 |
7.5 |
12.5 |
5.80% |
|
7 |
10.5 |
17.5 |
6.60% |
|
8 |
13 |
21 |
7.48% |
|
8.5 |
14.25 |
22.75 |
7.51% |
This would be plotted on a curve as follows: