Risk
a. There are basically two types of risk for a company, systematic risk, and unsystematic risk.
b. And, as discussed in the previous chapter, beta (β) represents the systematic risk of the company. There are many factors that affect beta as shown in the figure below:
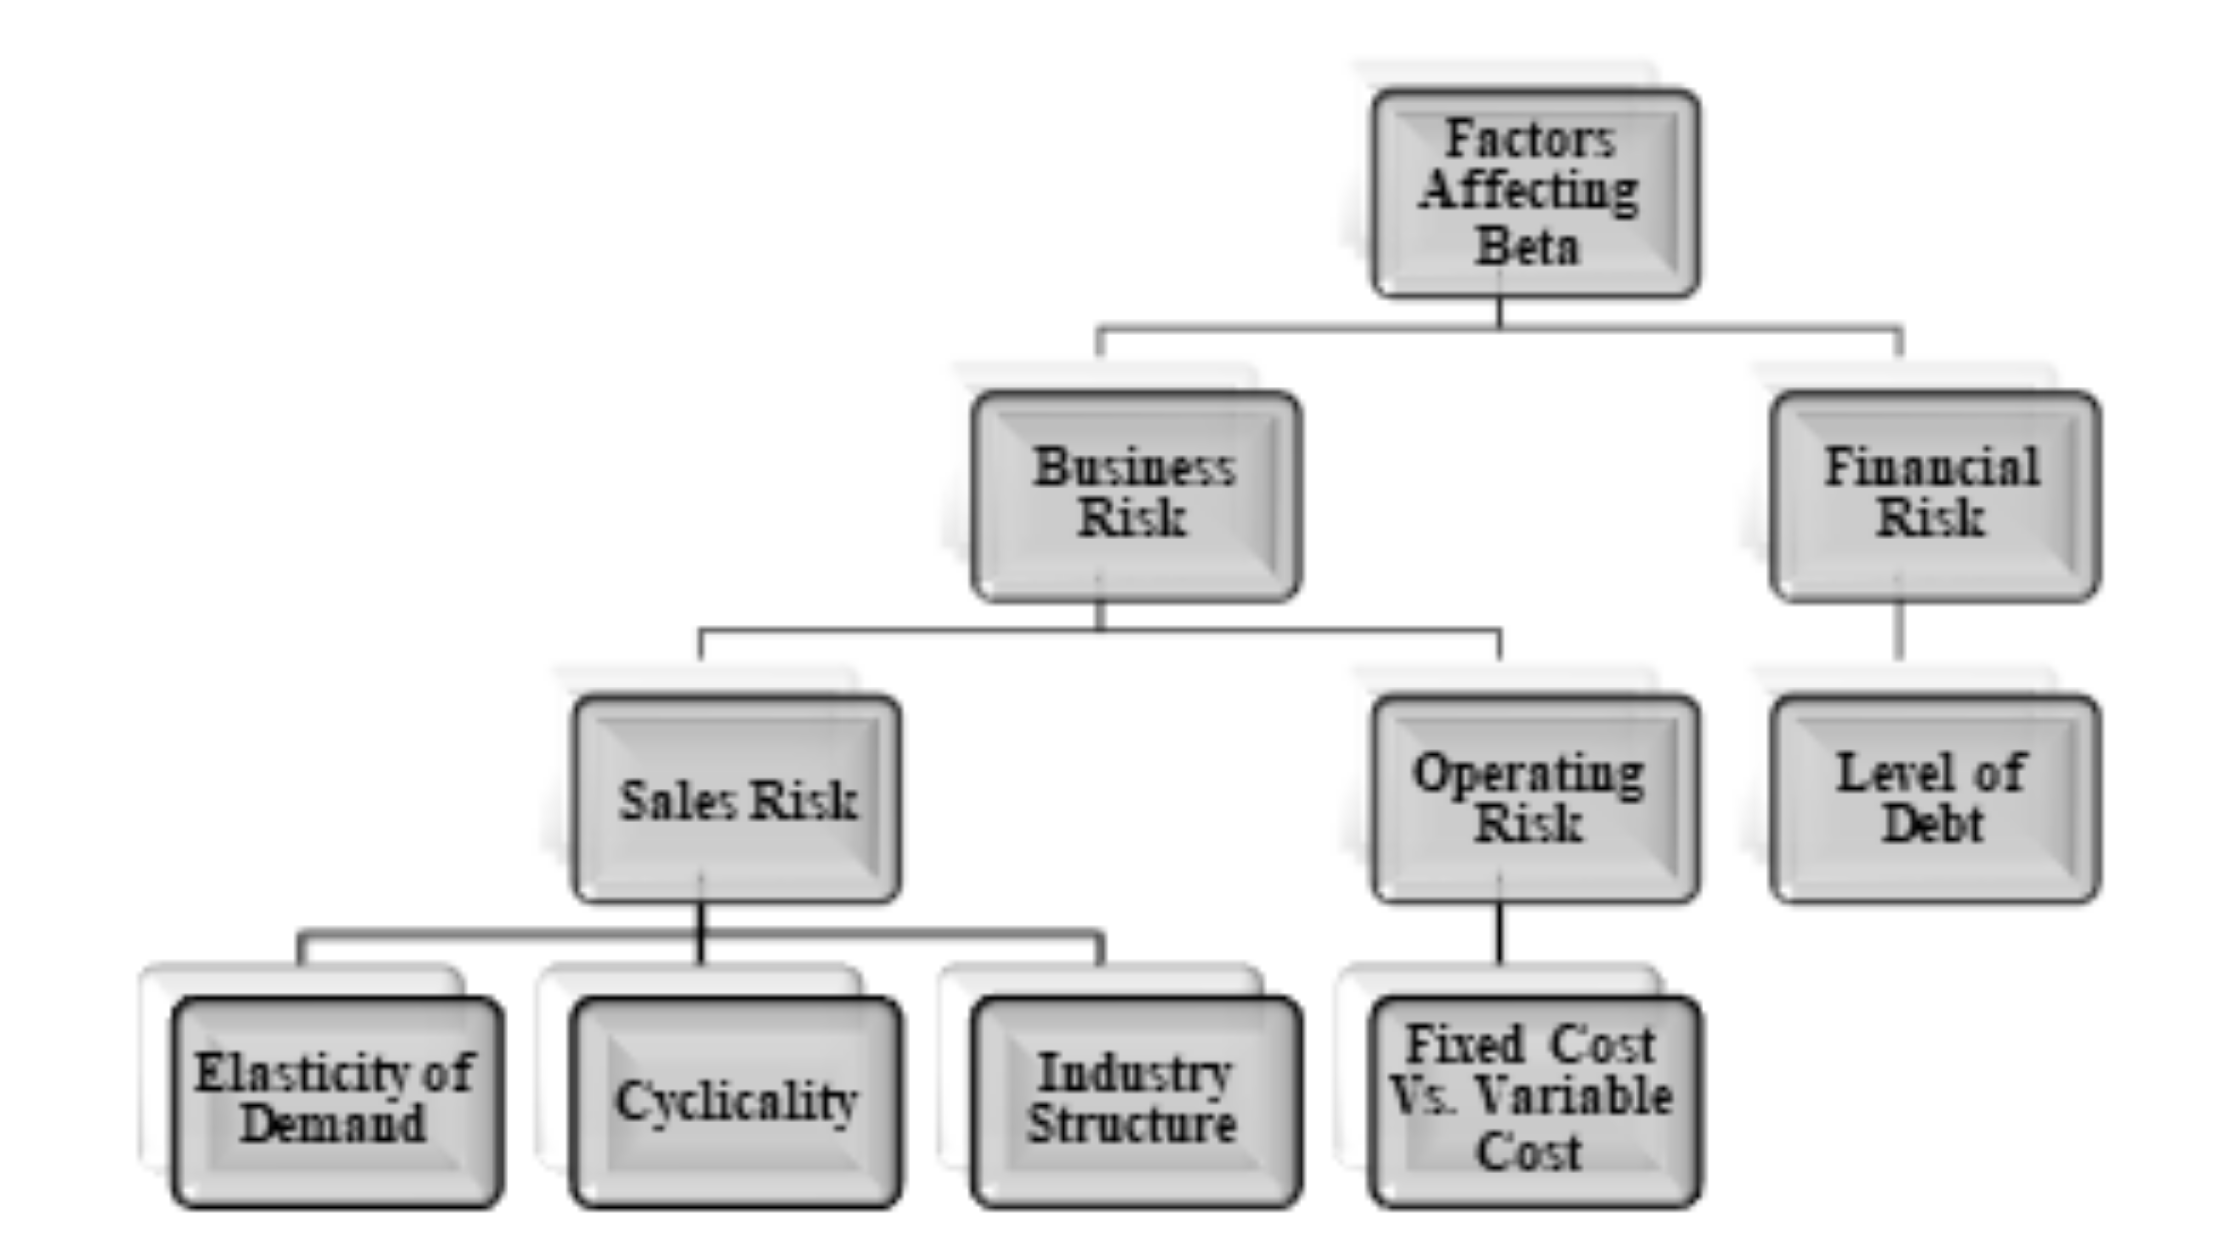
c. Business risk of a company is the risk related to the uncertainty of revenues, referred to as sales risk (which in turn is impacted by the elasticity of demand, its cyclicality, and the industry structure), and the operating risk.
d. Financing risk is the risk of the inability of the company to service the debt obligations. It is dependent on the level of debts.
e. The operating risk results from the mix of variable and fixed cost affects the operating leverage of the company. Operating leverage is the change in volatility of the earnings and cash flow due to the use of fixed cost in the company’s cost structure.
f. Financial Leverage, on the other hand, is the change in the volatility of earnings and cash flows due to the presence of debt in the capital structure of the company. It is the financial risk, caused due to debt in the capital structure that affects the financial leverage.
Example 1:
Say we have the following data available regarding two companies:
|
Particulars |
Company A |
Company B |
|
Sales Quantity |
15,000.00 |
15,000.00 |
|
Sale Price (Per Unit) |
10.00 |
10.00 |
|
Variable Cost (Per Unit) |
4.00 |
6.00 |
|
Contribution (Per Unit) |
6.00 |
4.00 |
|
Fixed Costs |
||
|
Operating Expenses |
50,000.00 |
25,000.00 |
|
Interest Expenses |
10,000.00 |
4,000.00 |
|
Total |
60,000.00 |
29,000.00 |
Using the information, we can prepare the income statement of the companies as follows:
|
Particulars |
Company A |
Company B |
|
Sales |
150,000.00 |
150,000.00 |
|
Less: Variable Cost |
60,000.00 |
90,000.00 |
|
Contribution Margin |
90,000.00 |
60,000.00 |
|
Less: Operating Expenses |
50,000.00 |
25,000.00 |
|
Operating Profit |
40,000.00 |
35,000.00 |
|
Less: Interest Expense |
10,000.00 |
4,000.00 |
|
Net Profit |
30,000.00 |
31,000.00 |
Through this information, we can calculate the break-even point and the operating break-even point. The formulas for calculating the same are:
Break-even Point = Fixed Cost / Contribution margin per unit
Operating Break-Even Point = Operating Fixed Cost / Contribution Margin Per Unit
Thus, the break-even units and operating break-even units of the two companies are:
|
Particulars |
Company A |
Company B |
|
Break-Even Point |
10,000.00 |
7,250.00 |
|
Operating Break-Even Point |
8,333.33 |
6,250.00 |
Graphically, this data can be presented as follows:
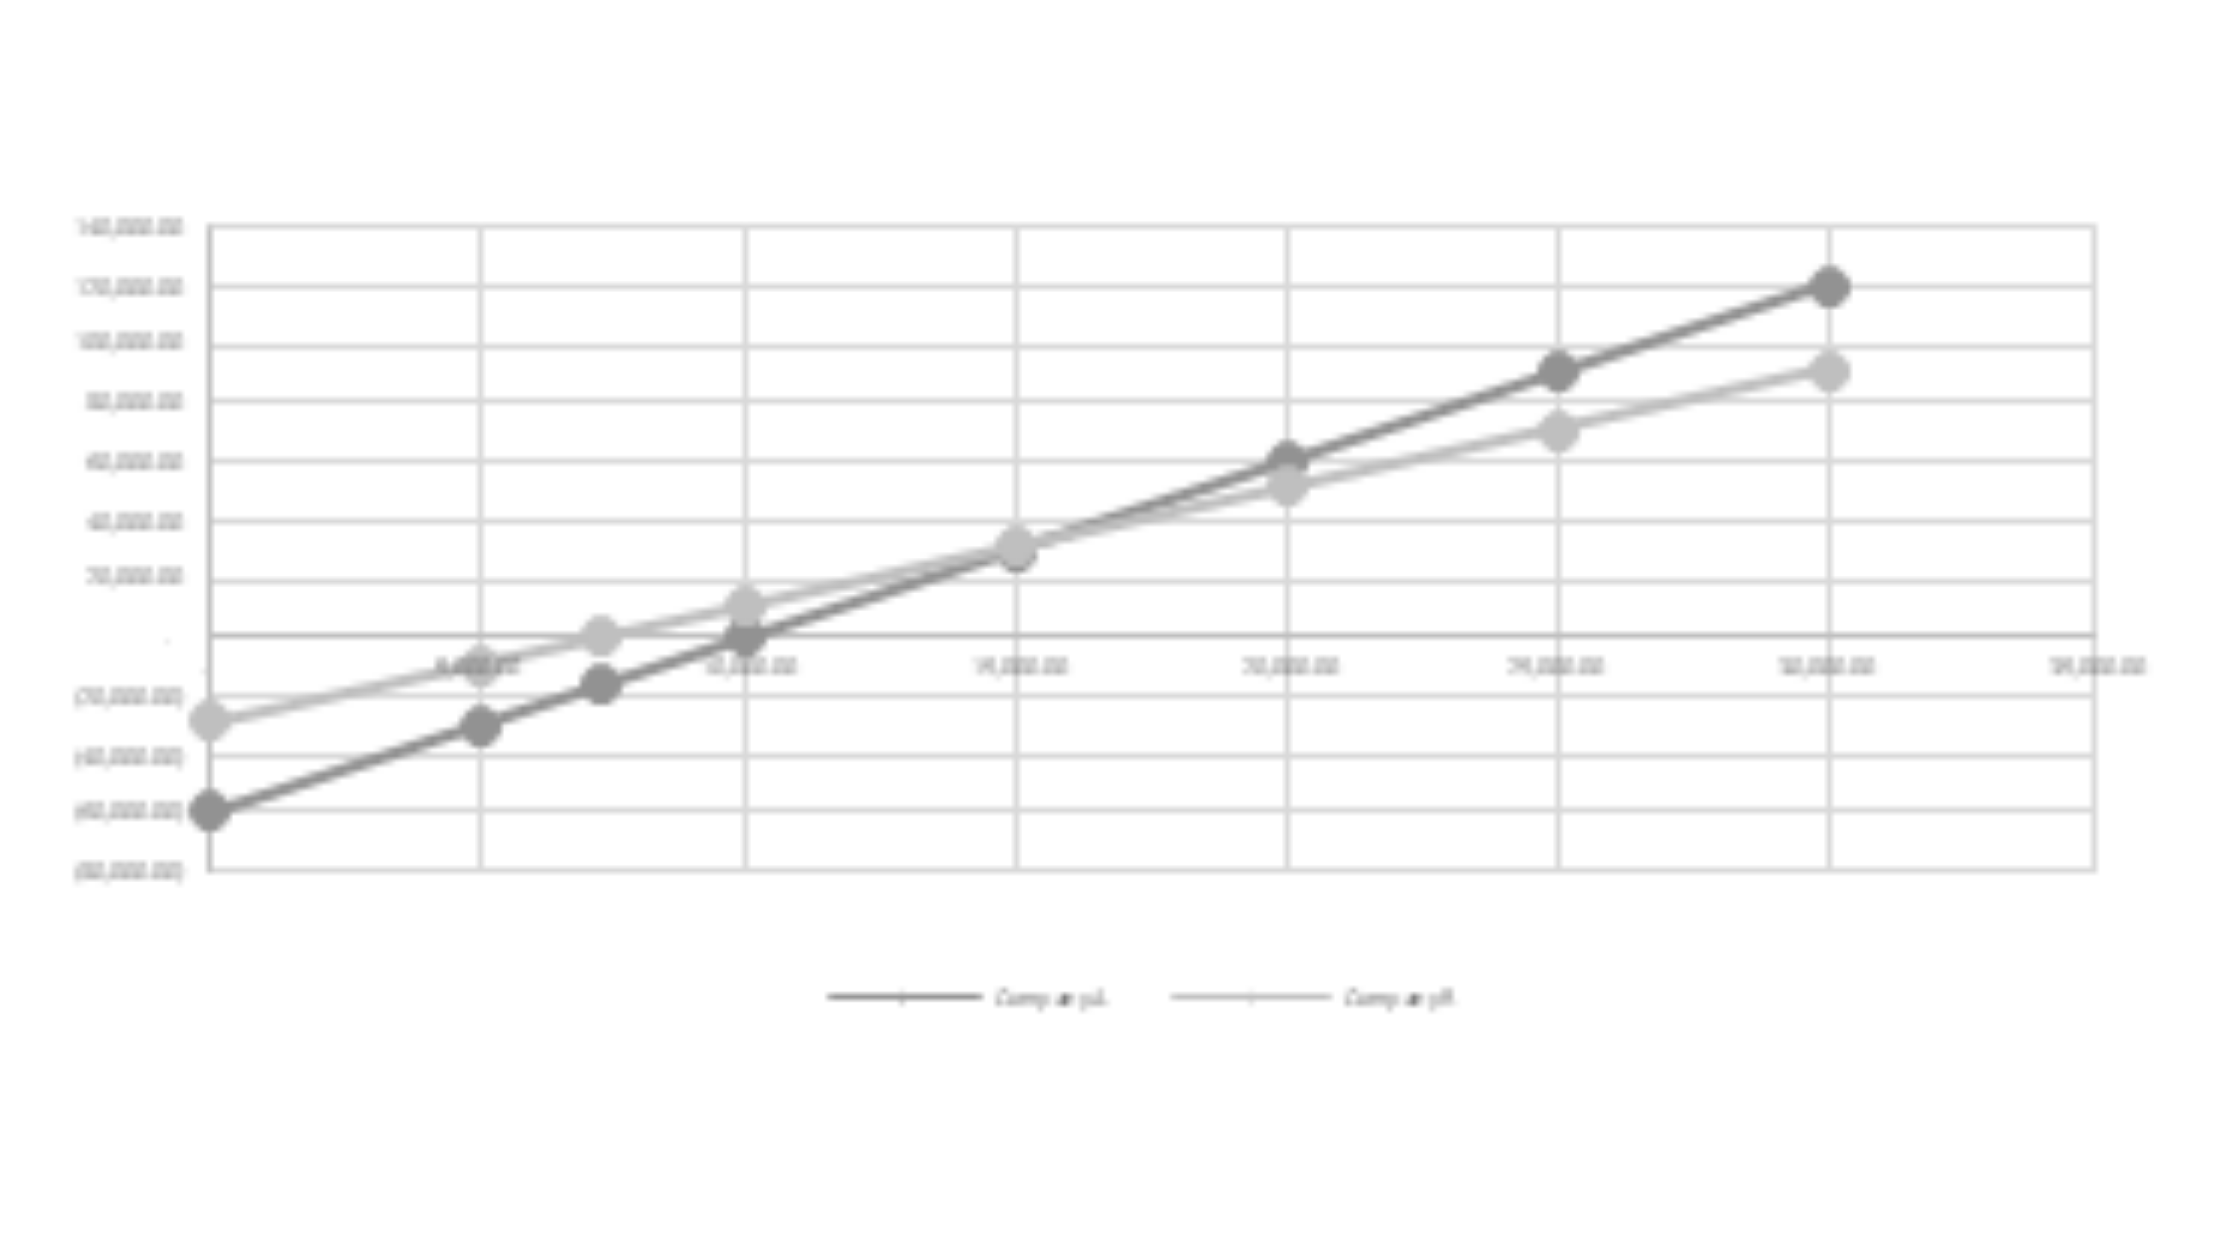
In the above chart (also known as Cost Volume Profit Graph or CVP Graph), the two lines can be presented as contribution times the number of goods sold reduced by the amount of fixed cost. It can be written as follows, in the form of an equation:
Company A: Net Income = 6×Q – 60,000
Company B: Net Income = 4×Q – 29,000
And we can see that the slope of the two lines in the above graph equals the contribution margin of the two companies. The point at which the two lines hit the x-axis represents the break-even points. It is the point, at which the net income of the two companies equals zero.
The point, at which the two lines intersect, represents the level of sales at which the levels of net income of both the companies are equal.
Components of Risk
As shown in the first figure, there are different factors that affect risk (as represented by the beta). The most primary factors that affect beta are business risk and financial risk. These are discussed in detail below:
1.1. Business Risk
a. Business risk is the possibility that the company may not be able to attain the levels of profits as anticipated or may run into losses due to many factors affecting the business.
b. It is the risk that directly affects the operating income of the company.
c. This risk is mainly due to many factors, such as business and economic conditions, industry demographics, government regulations, etc. All the companies in the same line of business face some business risk.
d. The business risk can be classified into two types, i.e. sales risk and operating risk.
1.1.1. Sales Risk
a. Sales risk is the risk of not being able to attain the levels of revenues as projected.
b. The sales risk is in turn affected by the two main components of revenues, i.e. the price and the number of goods sold.
c. The price of the goods sold is affected mostly by the industry structure, the level of competition, etc.
d. The quantity of goods sold is affected by the cyclicality of the product, the elasticity of demand, business conditions, etc.
e. The elasticity of demand affects both the price and quantity sold of the product.
1.1.2. Operating Risk
a. It is the risk associated with the operating profits of the company, the risk that the operating profits may not turn out as expected.
b. The operating risk is mostly dependent upon the mix of fixed and variable costs in the cost structure of the company.
c. The higher the fixed cost, the higher is the operating as well as a business risk.
d. The mix of fixed and variable costs in the cost structure of the company depends upon the industry structure, but the firms do have more discretionary control on the operating risk than it has on the sale risk.
1.2. Financial Risk
a. Financial risk is the risk of running out of funds for debt financing. It is the risk of liquidity and solvency of the firm.
b. Financial risk is the risk due to the level of debt and fixed financing charges in a firm.
c. The fixed financing charges may be due to the presence of debt or the preference shares in the capital structure of a company.
d. Financial risk is completely under the control of management. They can control the level of fixed that the company can afford to have and the optimal capital structure of the company.