LOS B requires us to:
Demonstrate the use of net present value (NPV) and internal rate of return (IRR) in allocating capital and describe the advantages and disadvantages of each method.
Investment Decision Criteria
As discussed, there are many different techniques that can help us in the process of capital budgeting. The most important of them is the net present value (NPV) and internal rate of return (IRR).
The other techniques are the accounting rate of return (ARR), payback period, and discounted payback period. But we will be discussing mainly NPV and IRR here.
Net Present Value (NPV)
This is one of the best techniques to help in deciding the best and the most rewarding alternative. As per this technique, the expected cash flow from the entire project (including the outflows) is discounted at the applicable cost of capital to the firm, to find out its present value. The resulting figure after adding the present value of all the cash inflows and reducing from it the present value of expected cash outflow is the present value of the project. The project with the highest positive NPV should be accepted, and if there is no choice (i.e. there is a single project), select the project if NPV is greater than/equal to zero.
Thus, the formula for calculating NPV is:

This can be explained with the help of the following example:
Suppose a project has an initial outlay cost of $ 80 million today and starting from a year from now, it will start generating an after-tax cash-flow of $ 20 million each year for the next five years. At the end of the fifth year, the equipment can be scrapped for $ 20 million.
The NPV of this project can be calculated as follows:
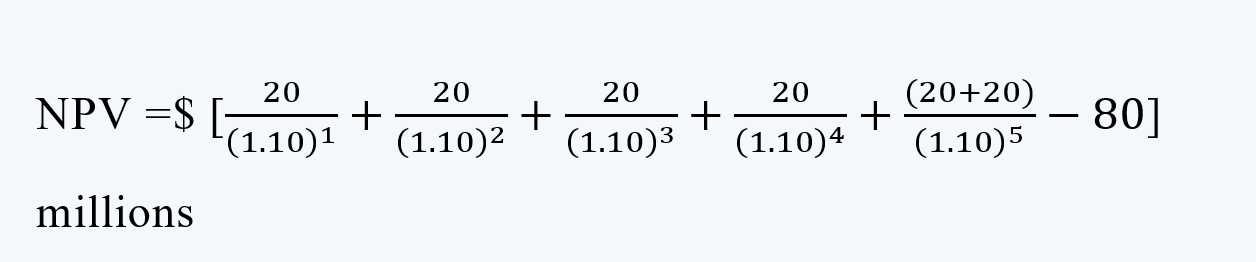
= $ [18.18+ 16.53+ 15.03+ 13.66+ 24.84- 80] millions
= $ 8.23 millions
Internal Rate of Return (IRR)
IRR is the discounting rate at which the present value of all the expected future cash inflows becomes equal to the present value all the expected future cash outflow. It is the rate of return generated internally by the project. The project with the highest IRR should be selected over others and if there is no choice (i.e. there is a single project), select the project if IRR is greater than/equal to the required rate of return or the weighted average cost of capital (WACC).
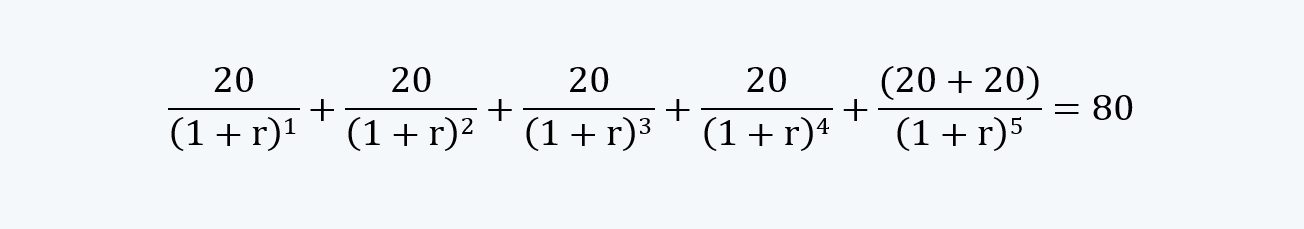
In the form of the equation we can find IRR, by solving for ‘r’ in the following equation:

The concept of IRR can be explained with the help of the following example:
Taking the stream of cash flow from the above example, we can solve for r, and get the value of IRR in the following equation:
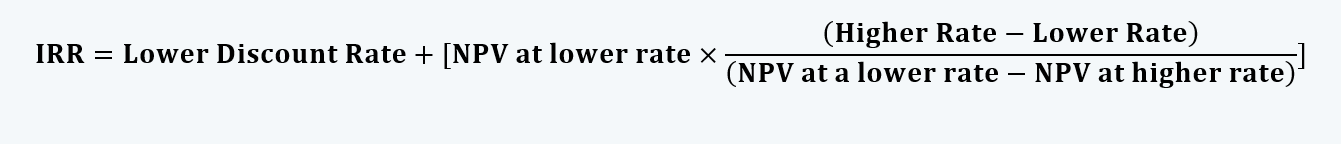
The value of r can be derived through either the hit and trial method or extrapolating two interest rates providing negative NPV and positive NPV, to reach a level where NPV equals zero.
In the above stream of cash flows at the rate of 10%, NPV is positive at $ 8.23 million. To get a closer value of IRR, however, it would be preferable to use an interest rate that gets IRR closer to zero. At 13%, the IRR is $ 1.20 million. Therefore, the rate at which NPV is zero would be higher than this. If we calculate the NPV in a similar fashion, at the interest rate of 14%, the NPV is negative $ 0.95 million. We can extrapolate these two figures using the following formula to find out the interest rate at which NPV is zero:
Therefore,
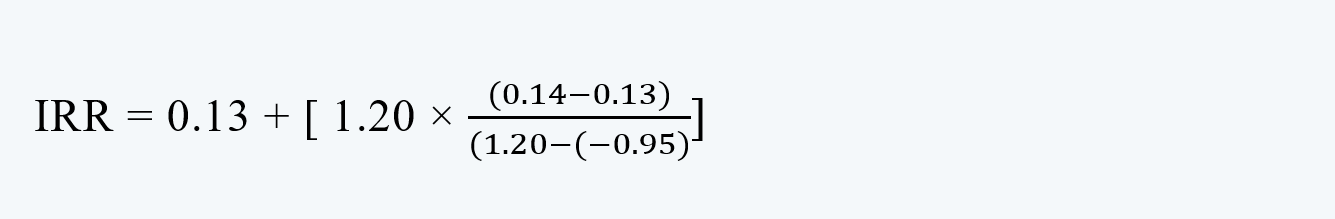
= 0.1356 or 13.56%
13.56% is the IRR or the rate at which the NPV would be zero.
NPV Vs. IRR
NPV Profile
NPV profile shows the different values of NPVs of the project at different discount rates. Different values of NPV at different discount rates for the above example are:
| Discount Rate | NPV |
| 0.10 | 8.23 |
| 0.11 | 5.79 |
| 0.12 | 3.44 |
| 0.13 | 1.20 |
| 0.1355 | 0.00 |
| 0.14 | (0.95) |
| 0.15 | (3.01) |
| 0.16 | (4.99) |
| 0.17 | (6.89) |
The graph for the NPV profile for the above example is:
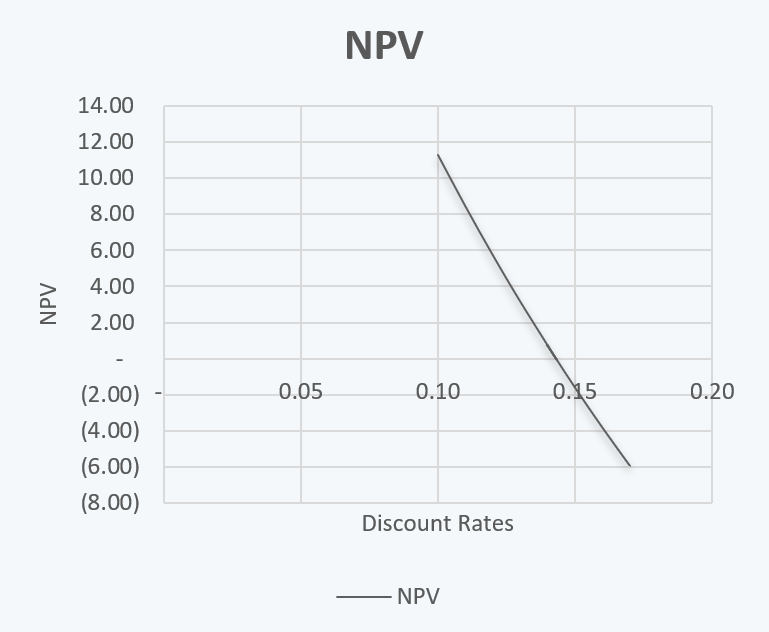
This reflects a normal well-behaved conventional NPV profile. And for a single conventional project, NPV and IRR mostly agree; i.e. when NPV is greater than zero, the IRR is also greater than the required rate of return (as seen in the above case).
Ranking Conflict
There may be cases where there is a conflict in the outcomes of the rankings based on NPV and IRR. Say, for example, consider the two projects, A and B, with different cash-flow patterns:
| Year | Cash Flows | NPV | IRR | ||||
| 0 | 1 | 2 | 3 | 4 | |||
| Project A | -100 | 40 | 40 | 40 | 40 | $26.79 | 21.86% |
| Project B | -100 | 0 | 0 | 0 | 200 | $36.60 | 18.92% |
Now, if we select the project based on NPV, project B is a better option. However, based on IRR, Project A is a better option.
Therefore, for selecting the project and resolving the conflict, we should prepare the table of NPV profile as follows:
| R | NPV(A) | NPV(B) |
| 0.00% | 60.0000 | 100.0000 |
| 5.00% | 41.8380 | 64.5405 |
| 10.00% | 26.7946 | 36.6027 |
| 15.00% | 14.1991 | 14.3506 |
| 18.92% | 5.7043 | 0.0000 |
| 20.00% | 3.5494 | -3.5494 |
| 21.86% | 0.0000 | -9.3113 |
| 25.00% | -5.5360 | -18.0800 |
So, from the above table, we can see that till the discounted rate is above the level of 18.92%, the NPV of project B is above that of project A. Up to this level of discount rate project B should be selected. However, starting the level of the discount rate of 18.92%, project A becomes a better investment option.
We can also depict the above NPV profile in the form of a graph as follows:
Like in the above example, the NPV profile acts as a useful tool in selecting the better investment option, under a different range of required rates of returns. Whenever the NPV and the IRR rank the mutually exclusive projects differently, we should choose the one with higher NPV (this is mainly because of the reinvestment assumption of NPV, which states that all cash flows can be reinvested at the discount rates; and at IRR, since the NPV is zero, the reinvestment is not likely).
Also, the main reasons for choosing NPV over IRR in case of a conflict are:
i. NPV shows the exact currency amount of returns earned.
ii. NPV is considered a more realistic method, economically, of calculating returns.
iii. In the case of non-conventional cash flows, there could be multiple IRRs, as well.
Ranking Conflict Due to Different Project Scale
Now consider the projects with different levels of initial outlay:
| Year | Cash Flows | NPV | IRR | ||||
| 0 | 1 | 2 | 3 | 4 | |||
| Project A | -200 | 80 | 80 | 80 | 80 | $53.59 | 21.86% |
| Project B | -800 | 300 | 300 | 300 | 300 | $150.96 | 18.45% |
Here also, if we select the project on the basis of NPV, project B is a better option. However, on the basis of IRR, Project A is a better option.
Therefore, for selecting the project and resolving the conflict, we should prepare the table of NPV profile as follows:
| R | NPV(A) | NPV(B) |
| 0.00% | 120.0000 | 400.0000 |
| 5.00% | 83.6760 | 263.7852 |
| 10.00% | 53.5892 | 150.9596 |
| 15.00% | 28.3983 | 56.4935 |
| 18.45% | 13.3333 | 0.0000 |
| 20.00% | 7.0988 | -23.3796 |
| 21.86% | 0.0000 | -50.0000 |
| 25.00% | -11.0720 | -91.5200 |
From the above table, we can see that till the discounted rate is above the level of 18.45%, the NPV of project B is above that of project A. Up to this level of discount rate project B should be selected. However, starting the level of the discount rate of 18.45%, project A becomes a better investment option.
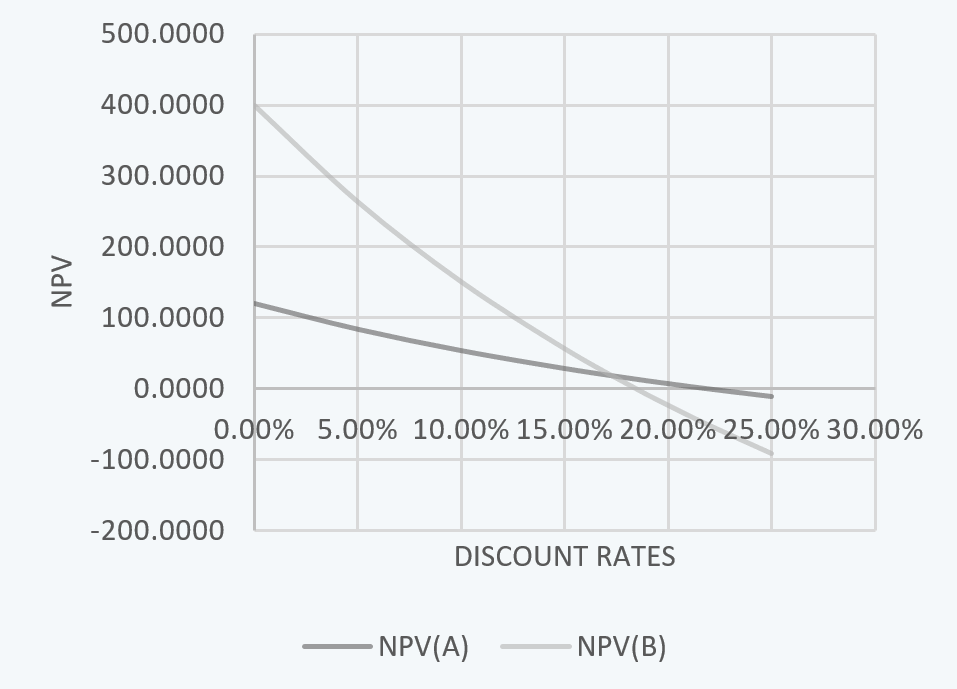
We can also depict the above NPV profile in the form of a graph as follows:
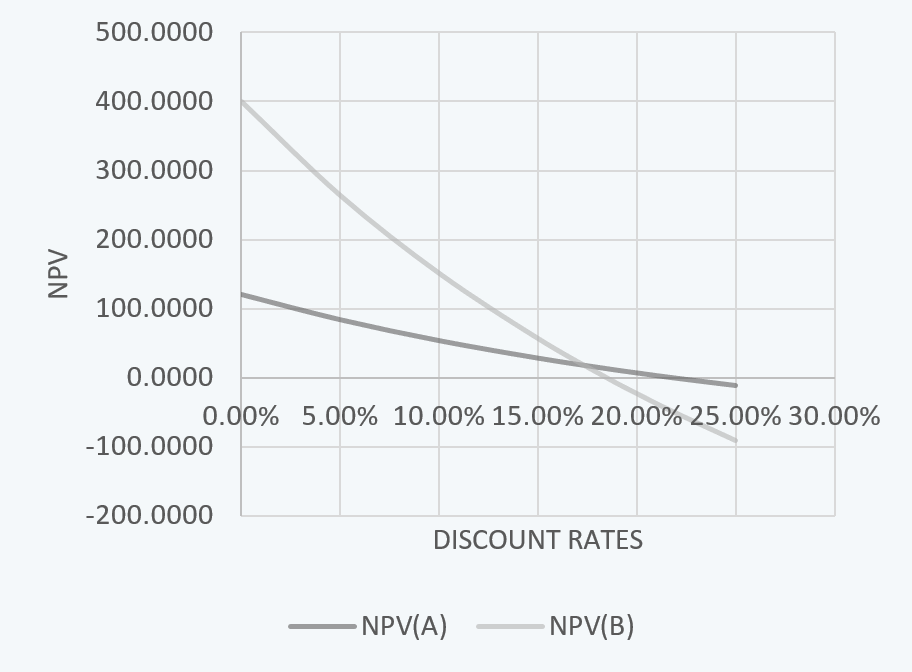
Here another question that needs to be answered is whether it is desirable to invest in multiple smaller projects with higher IRR or one big project with higher NPV. To resolve this issue, we can also consider the cumulative total NPV if multiple investments are made in a smaller project.
Multiple IRRs
In the case of multiple sign changes, there can be more than one IRR. Consider the following stream of cash flow, for example:
| Year | Cash Flows |
| 0 | 100 |
| 1 | -800 |
| 2 | 800 |
| 3 | 600 |
Here, there are two sign changes, i.e. from positive to negative at year 1 and from positive to negative at year 2. Thus, this cash flow would have possibly two IRRs. The NPV stream of this project would be as follows:
| R | NPV |
| 25.00% | $279.20 |
| 50.00% | $100.00 |
| 75.00% | $16.03 |
| 82.80% | $0.00 |
| 100.00% | ($25.00) |
| 200.00% | ($55.56) |
| 300.00% | ($40.63) |
| 400.00% | ($23.20) |
| 500.00% | ($8.33) |
| 566.45% | $0.00 |
| 600.00% | $3.79 |
| 700.00% | $13.67 |
| 800.00% | $21.81 |
The two IRRs of this project are 82.80% and 566.45%, where the NPV of the project is zero.
This NPV stream can be graphed as follows:
NO IRR
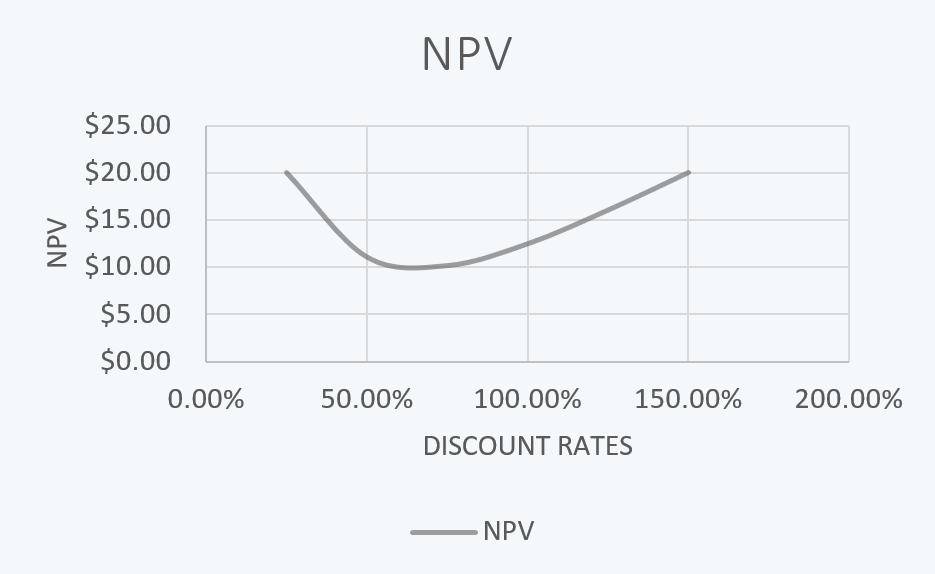
There may be situations, where there may not be any solution n for IRR. Consider the following stream of cash flow, for example:
| Year | Cash Flows |
| 0 | 100 |
| 1 | -300 |
| 2 | 250 |
Here, there is no IRR. The selection of the project would be made based on NPV. Thus, the NPV stream of the project is:
| R | NPV |
| 25.00% | $20.00 |
| 50.00% | $11.11 |
| 75.00% | $10.20 |
| 100.00% | $12.50 |
| 125.00% | $16.05 |
| 150.00% | $20.00 |
And the NPV graph would be: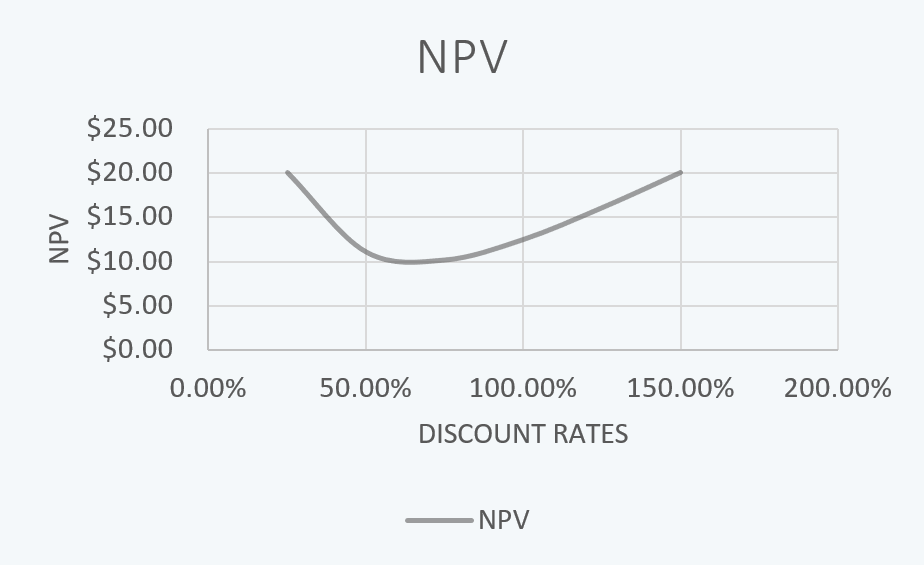
Since the NPV of this project is always above zero, this project can be selected.