LOS I and J require us to:
i. describe properties of Student’s t-distribution and calculate and interpret its degrees of freedom
j. calculate and interpret a confidence interval for a population mean, given a normal distribution with 1) a known population variance, 2) an unknown population variance, or 3) an unknown population variance and a large sample size
a. When the population variance is unknown and the sample is random, the distribution that correctly describes the sample mean is known as the t-distribution.
b. Some of the properties of a t-distribution are:
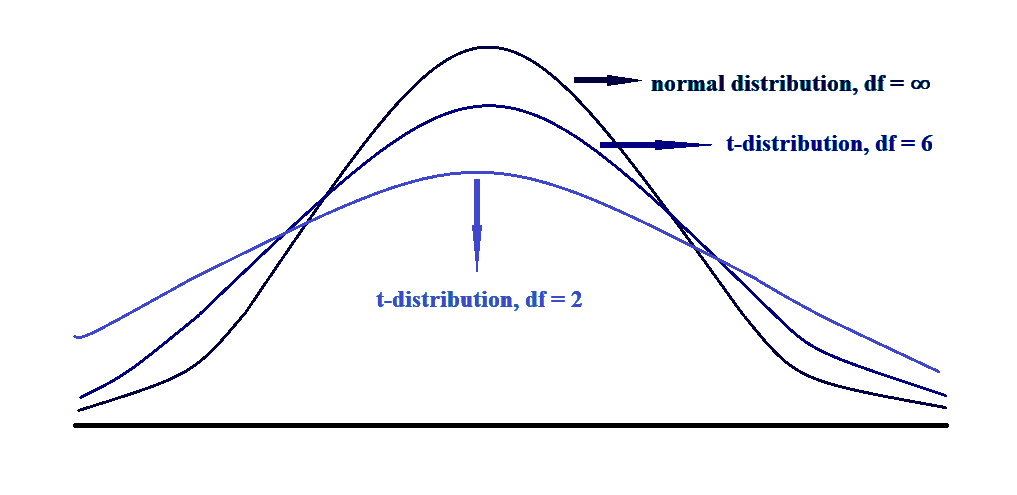
i. It is symmetrical like a normal curve.
ii. It is defined by a single parameter, i.e. degree of freedom, which is the sample size minus one.
df = n – 1
iii. A t-distribution has a lower peak than the normal curve and a fatter tail.
iv. As the degree of freedom increases the shape of a t-distribution approaches the shape of a normal distribution curve.
c. Thus, say we have a sample size of 10 and its mean is also 10, then in a t-distribution, we can select 9 elements freely, but the 10th element is constrained in such a way that the mean of the distribution should be 10. Thus, for a sample size of n, there is a degree of freedom of n-1.
d. We can select z or t for estimating the confidence intervals based on the following table:
|
When Sampling from a: |
Small Sample, n < 30 |
Large Sample, n > 30 |
|
Normal distribution with σ2 known |
Z |
z |
|
Normal distribution with σ2 unknown |
T |
t or z |
|
Non-normal distribution with σ2 known |
N/A |
z |
|
Non-normal distribution with σ2 unknown |
N/A |
T |
The use of t-statistic always produces more conservative (i.e. wider) intervals.