LOS C requires us to:
explain uses of trend, support, resistance lines, and change in polarity.
Trend
a. A market trend is a perceived tendency of financial markets to move in a particular direction over time. These trends are classified as secular for long time frames, primary for medium time frames, and secondary for short time frames.
b. The trend is a very important thing to analyze for technical analysts. A lot of their decisions and positions are based on trends.
Two Aspects of Trends: Uptrends and Downtrends
Uptrends
a. The uptrend line is the trend line for the stocks or securities showing upwards movement in the prices of the stocks.
b. The main feature of the uptrend line is that every following low hit by the stock is higher than the previous low and so is every following high.
c. The slope of the trend line connecting every low is upward The trend line is drawn by joining every successive low.
The reason behind joining the lows is that whenever the prices reach a new high, there is a retracement until it finds resistance towards resuming the upwards trend.
d. The trend line for an uptrend acts as a support until the trend is over and there is a breakdown.
An example of the uptrend line is: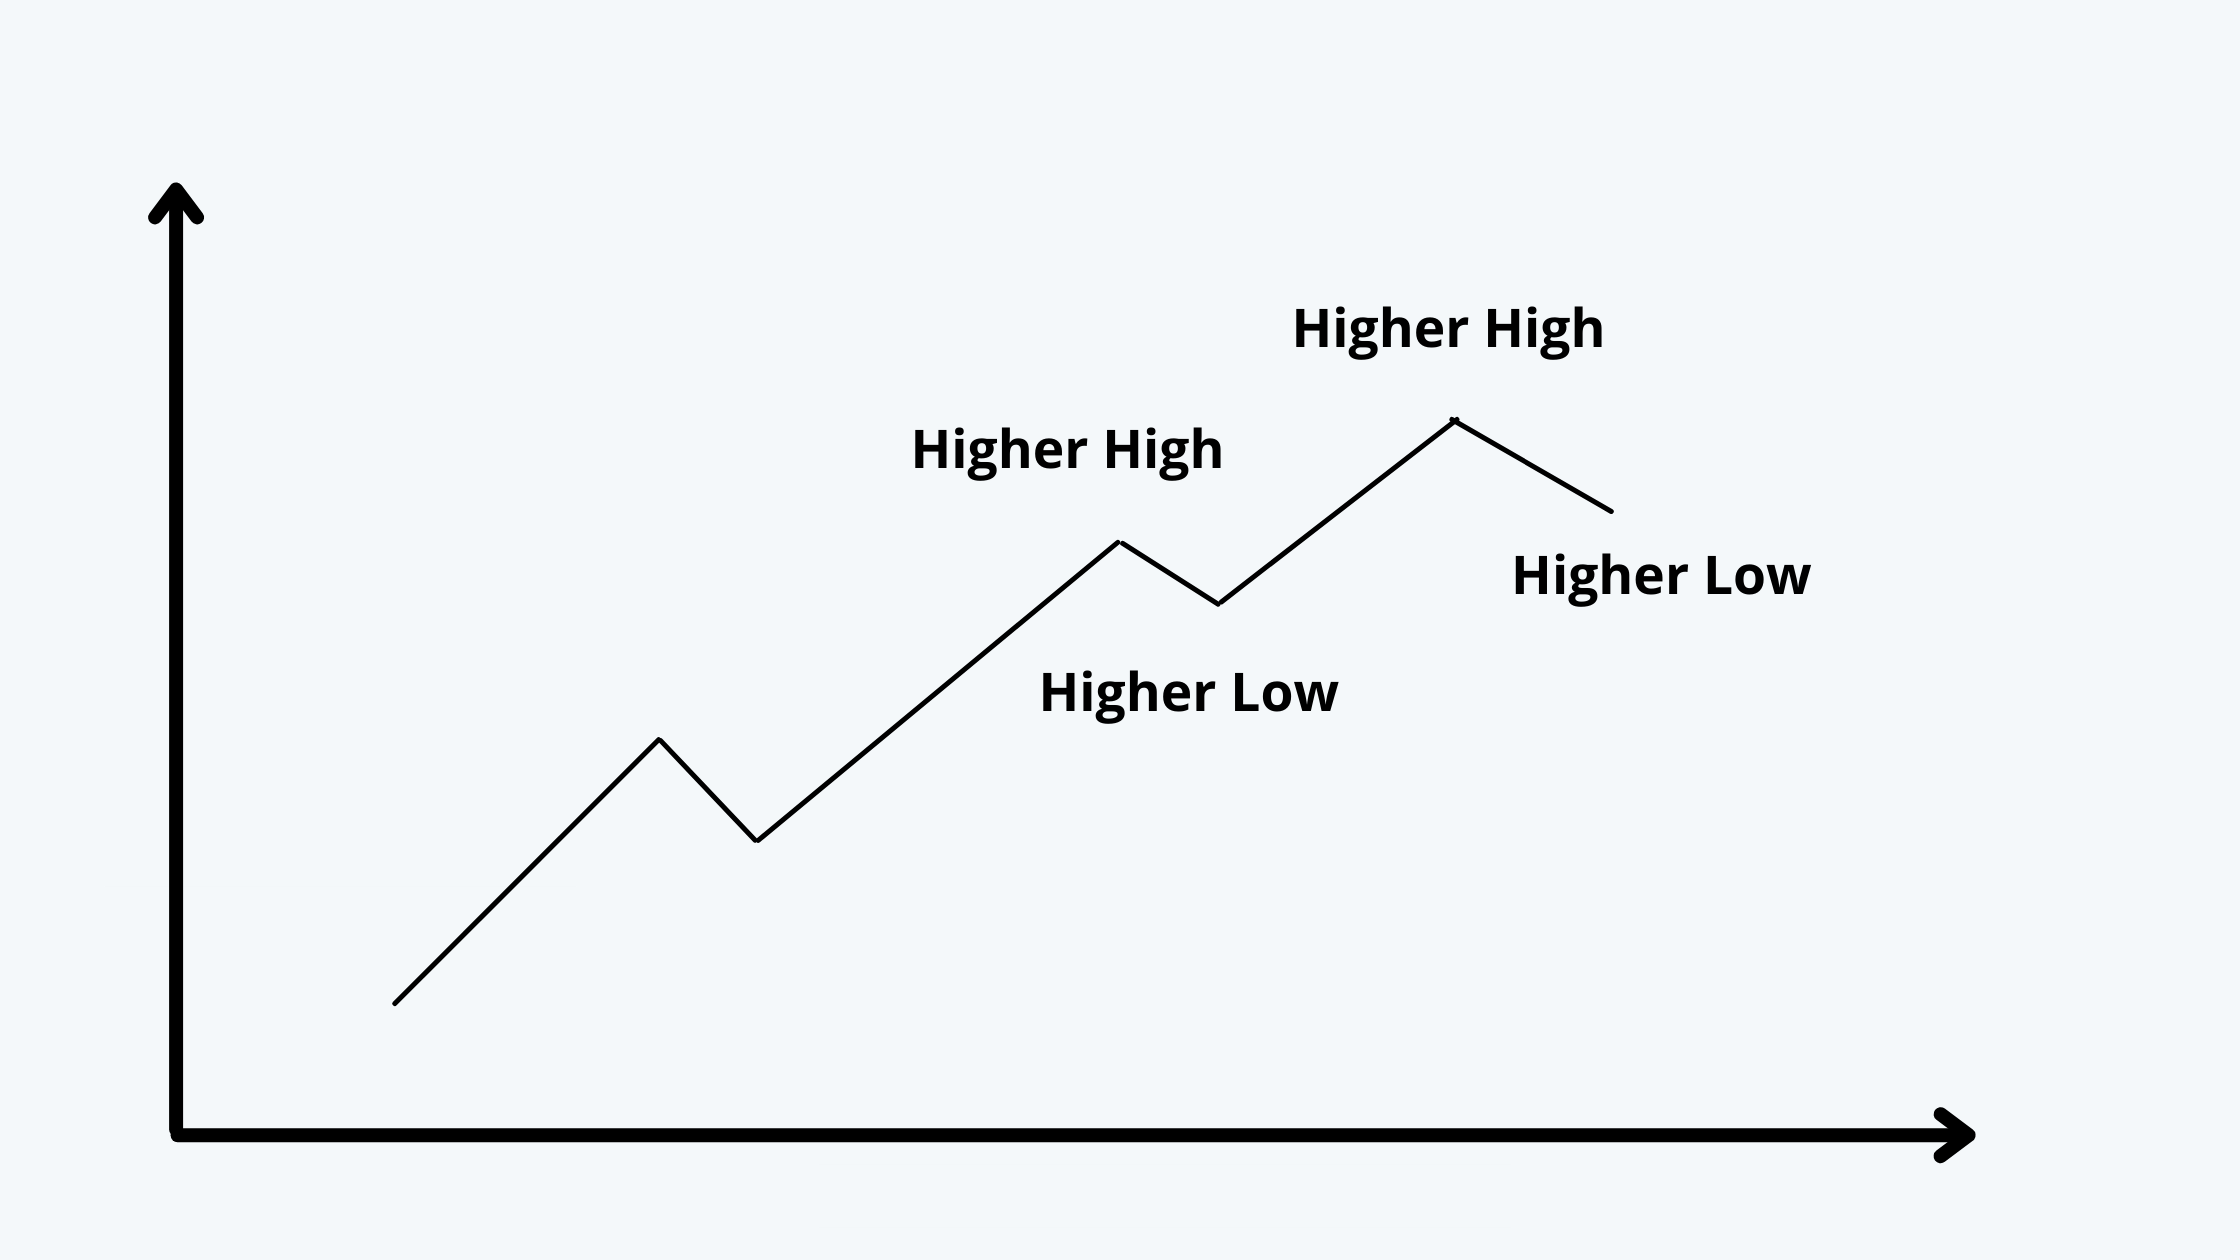
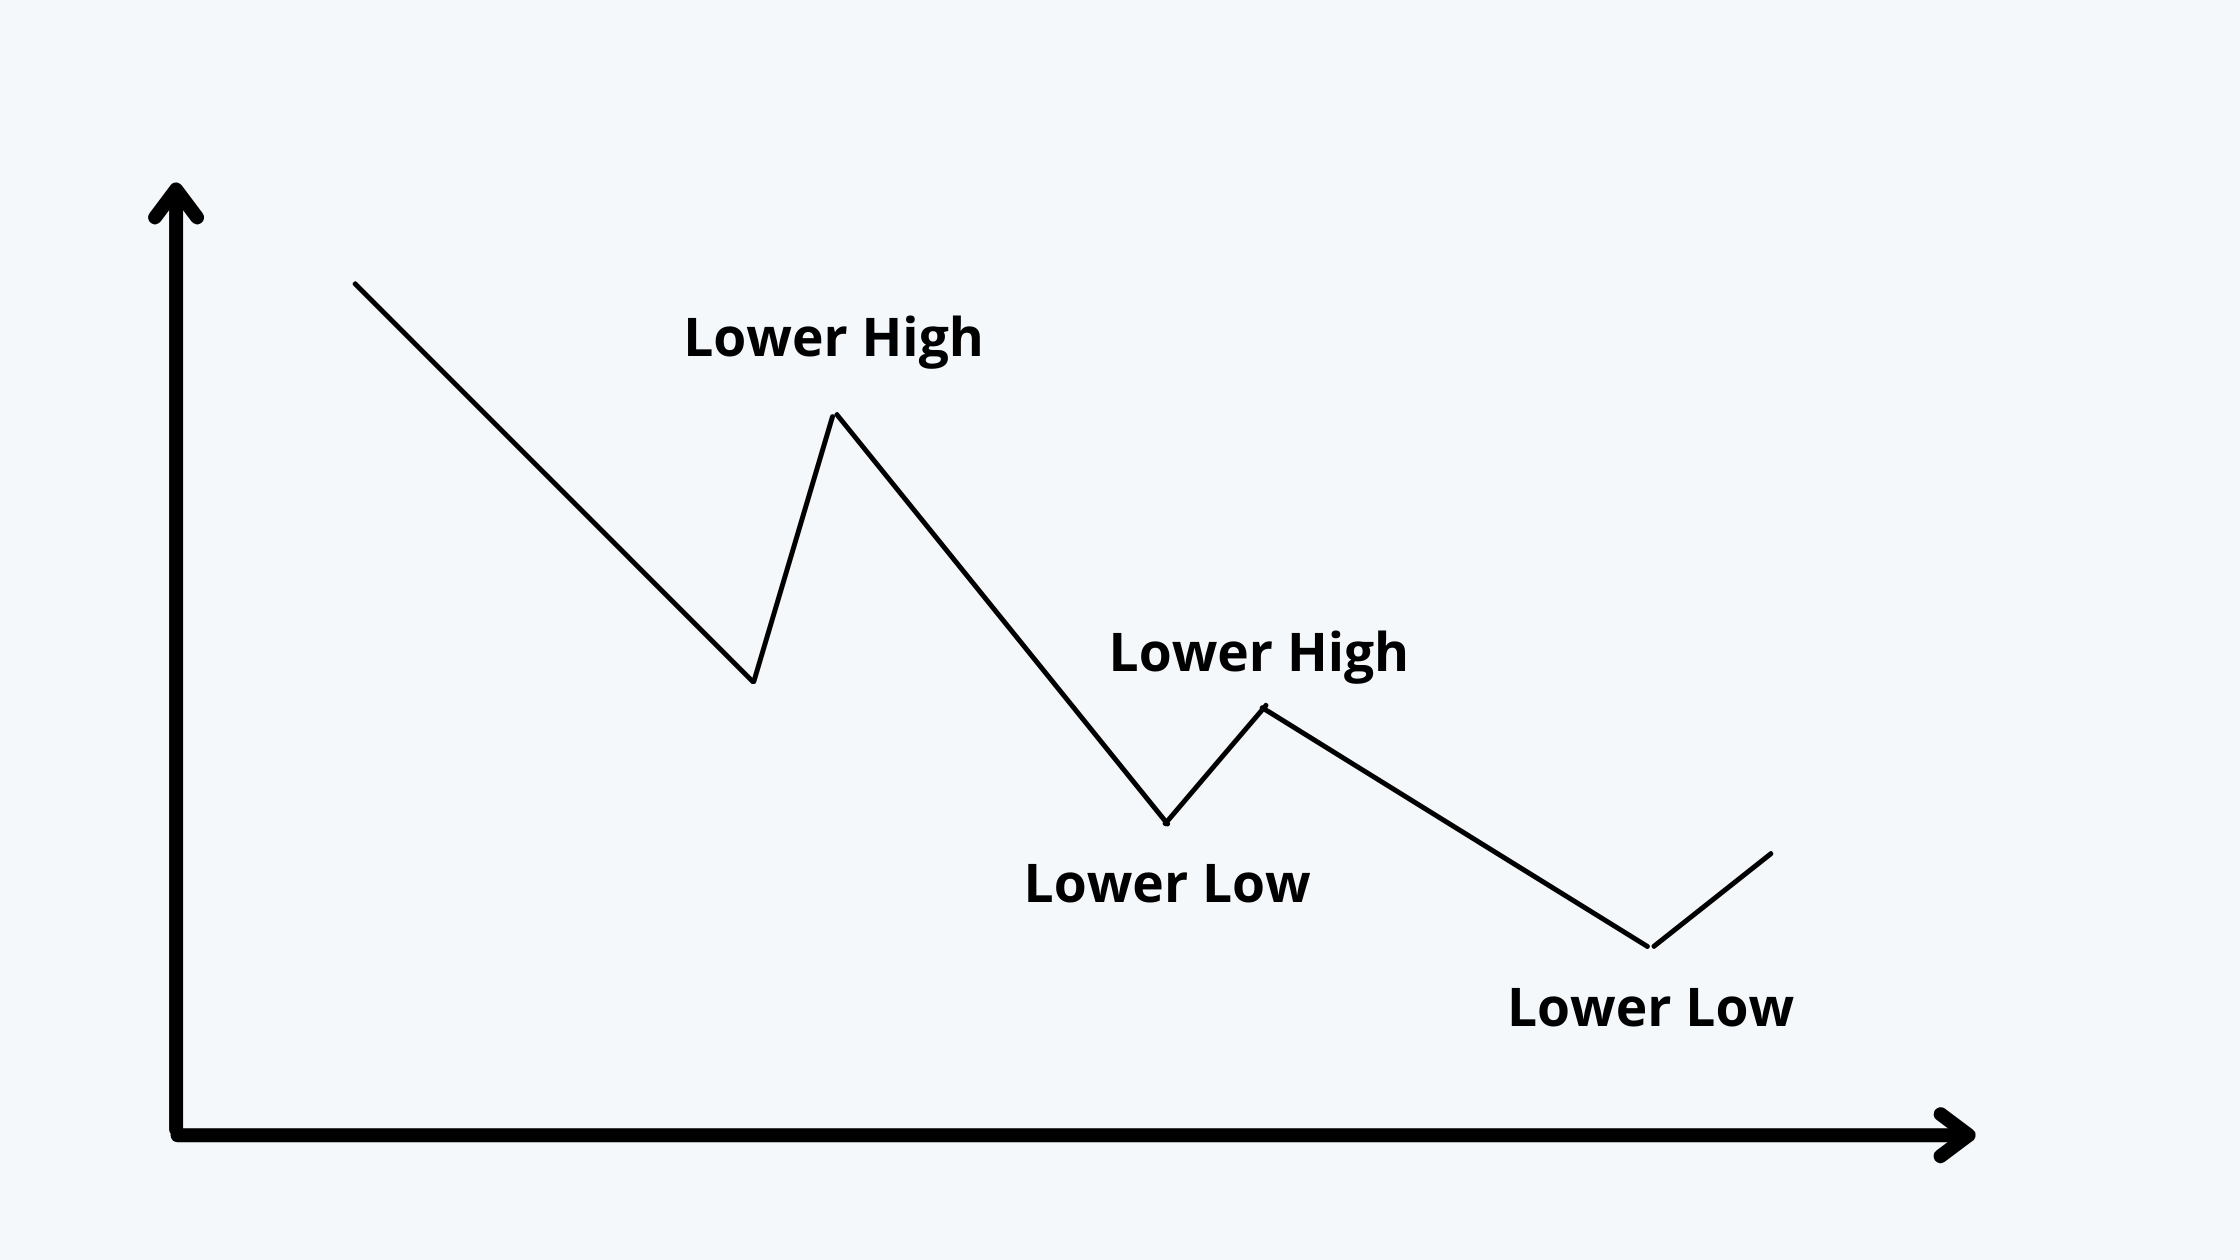
Downtrend
a. The downtrend line is the trend line for the stocks or securities showing downwards movement in the prices of the stocks.
b. The main feature of the downtrend line is that every following high and low hit by the stock is lower than the previous lows and highs.
c. The slope of the trend line connecting every high is downwards sloping. The trend line is drawn by joining every successive high.
The reason behind joining the highs is that whenever the prices reach a new low, there is a retracement until it resumes the downwards trend.
d. The trend line for a downtrend acts as resistance until there is a breakdown from the downtrend.
e. An example of the downtrend line is:
Support and Resistance
a. A support price is a price level at which falling prices have stopped falling and either moved sideways or reversed direction; usually seen as a price chart pattern.
b. Support line is a trendline drawn on a price chart through the troughs of an upward price movement in a market. It indicates the points where the market is finding support.
c. It is the low price range in which the further price fall can be averted through some buying activities in the market.
d. Resistance is a price level at which the rising prices have stopped rising and either moved sideways or reversed direction; usually seen as a price chart pattern
e. The resistance level indicates the level at which the increase in the price of a share has repeatedly halted as there are more sellers at that particular price than buyers. If at a subsequent rise, the price penetrates the line, it is supposed to signify a bull phase, taking the price upwards.
f. A resistance line is a line on a chart, that indicates the price level at which rising prices have stopped rising and have moved sideways or reversed direction.
Change in Polarity
a. The Principle of Polarity states that once a Resistance (Support) level is breached, it changes its nature and becomes Support (Resistance) the next time it is approached.
b. This mainly happens due to changes in the levels of demand and supply. So once the resistance is breached, the new value that is reached becomes the support level.
c. For example, if there is a stock that never crosses a mark of $ 45 in the long run. Now if the price finally breaks to the $ 47 mark, then $ 47 becomes the new support level. But an important thing to note here is that the breach should be of a significant amount.