LOS C requires us to:
describe characteristics of the major asset classes that investors consider in forming portfolios
a. Based on their preferences, there are three types of investors. They are:
i. Risk-Averse. These are the investors that have to dislike the risk, so they basically like to make investments in the assets that have a sure return (even if, they are a little less comparatively).
The main target of a risk-averse investor is to maximize returns at a given level of risk and minimize risk at a given level of return.
ii. Risk Seekers. These are the investors who seek risk with an eye to achieve higher returns. These are the investors who like to take a gamble and get satisfaction from the uncertainty.
iii. Risk Neutral. These investors are indifferent towards the risk and seek higher returns regardless of risk.
b. The preference for the risk, as discussed above depends on the risk tolerance of the investors. Risk tolerance is the level of risk willingly accepted by the investors to achieve their investment goals.
A lower risk tolerance indicates a lower level of acceptable risk and a higher risk aversion.
c. As per the utility theory and indifference curve approach, as discussed in microeconomics, the investors derive satisfaction or utility from particular choices relative to others.
Thus, for a risk-averse investor, the utility function is:

d. The main assumptions behind the above utility approach are:
i. that investors are generally risk-averse but prefer more return to less,
ii. investors are able to rank different portfolios based on their preferences, and
iii. the preferences of the investors are internally consistent, and this consistency comes from the rationality of the investors.
e. The main conclusions of the above theory of indifference curve are:
i. the utilities are unbounded on both sides, i.e. they could be both highly positive and negative,
ii. higher returns result in higher utility, and
iii. higher the value of A, the higher is the risk aversion and the higher the negative effect on utility.
f. The degree of risk tolerance of an investor depends upon the value of A.
i. If A is greater than 0, the investor is risk-averse.
ii. If A equals 0 then the investor is risk-neutral.
iii. If A is less than 0 then the investor is risk-seeking.
g. We can plot the indifference curve of a typical investor on a graph as follows:

i. This indifference curve plots the risk and returns trade-off for a given level of utility.
ii. These curves are upward sloping, indicating that higher risk must be accompanied by a higher return.
iii. The curve is non-linear in shape, having an increasing This is mainly because the required return increases at an increasing rate, also showing the diminishing marginal utility of wealth.
h. The degree of risk aversion can also be seen from the slope of an indifference curve, as follows:

The higher the slope of the indifference curve, the more risk-averse the investor is.
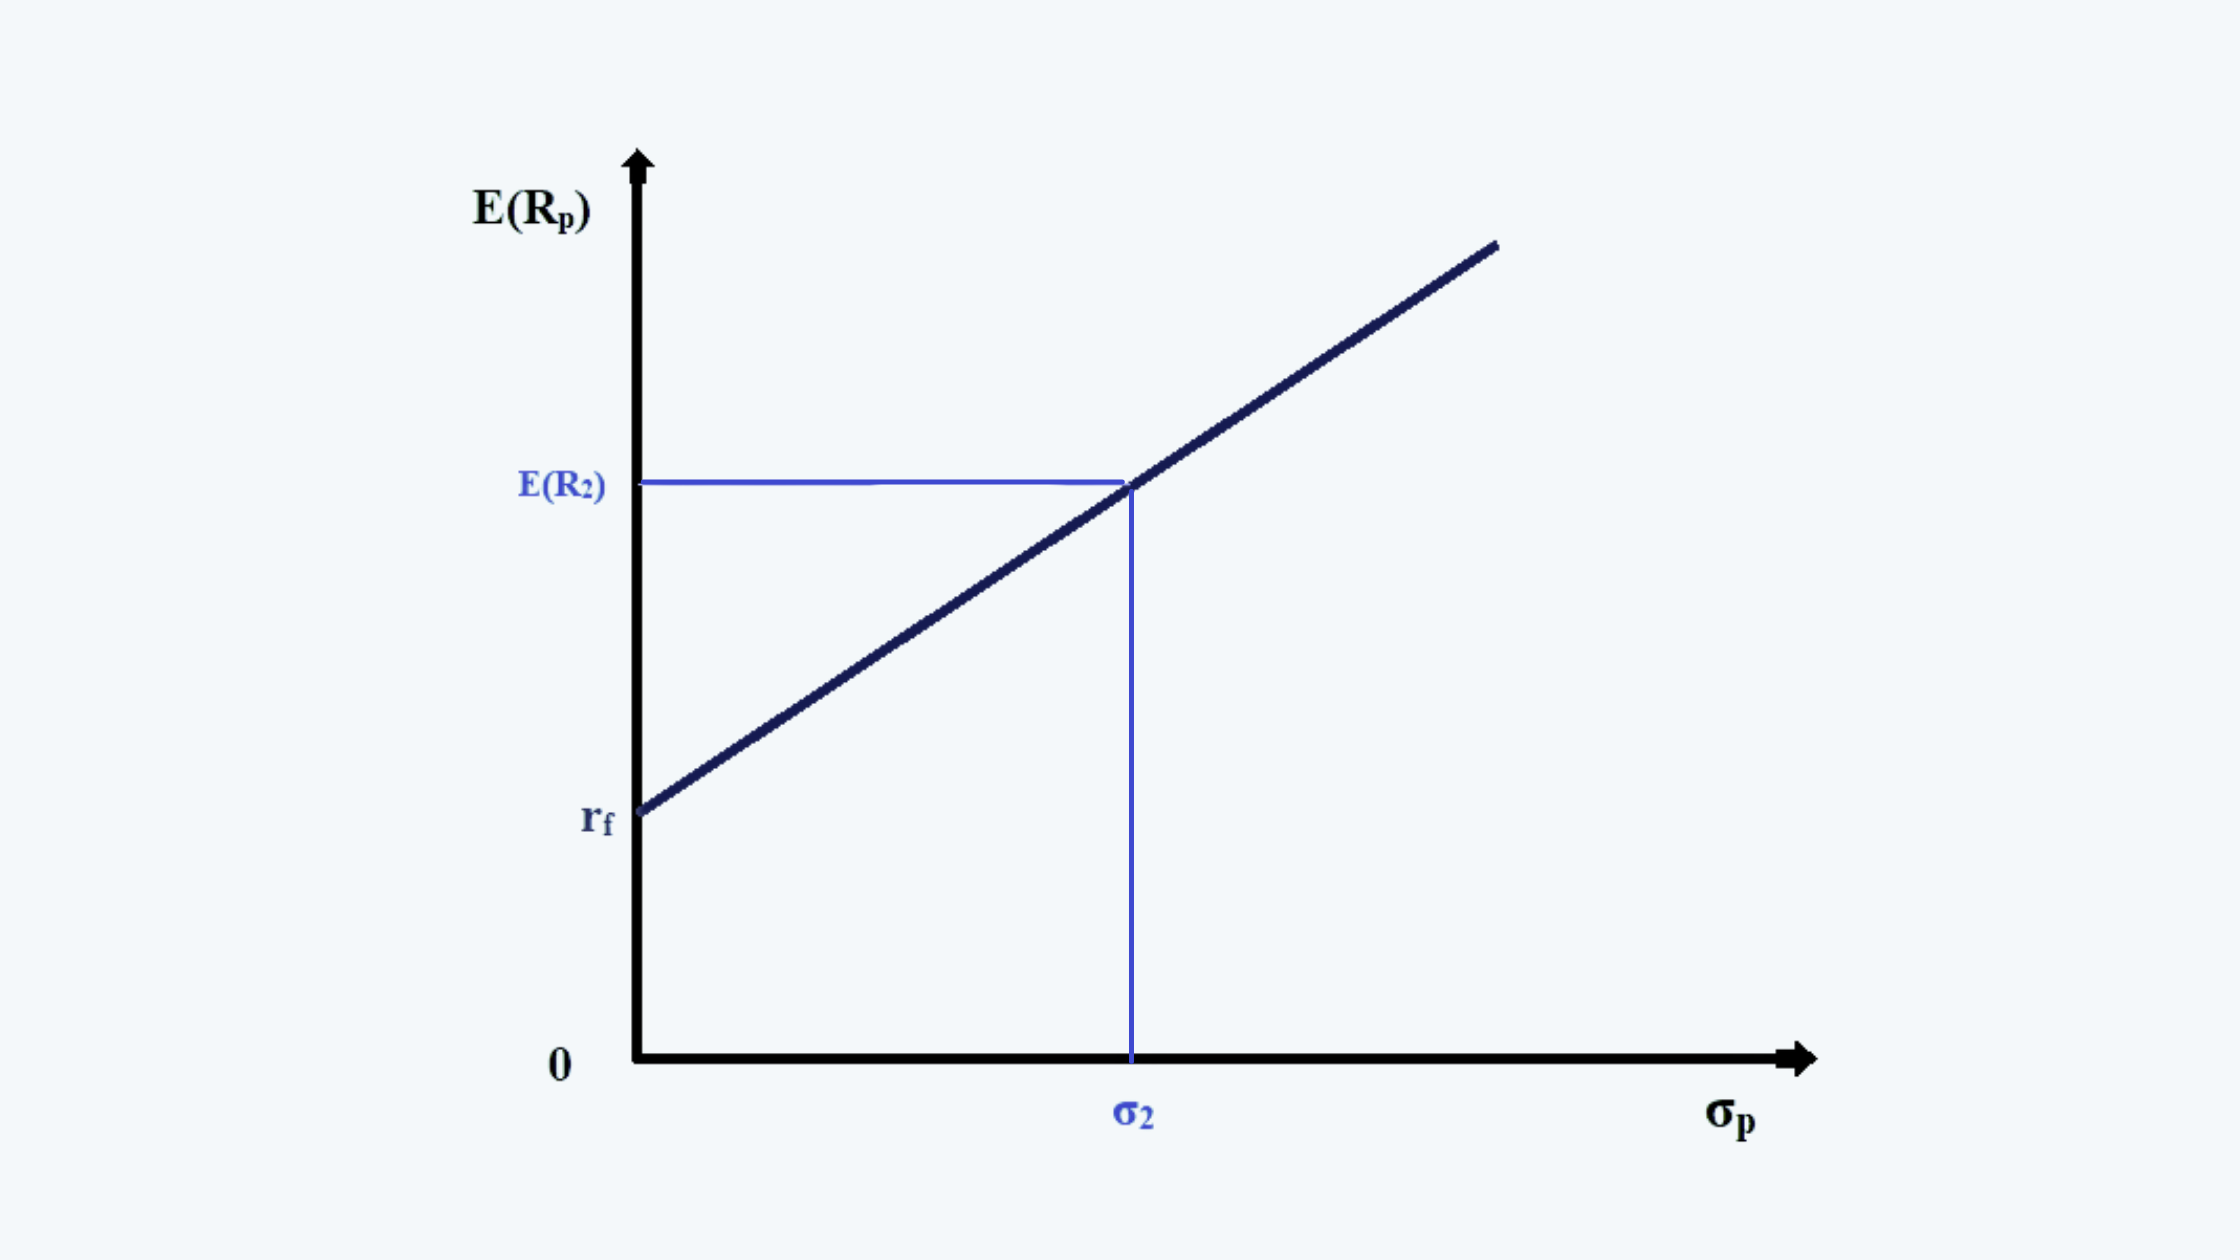
i. We can build a portfolio with just two assets, one risk-free asset and the other, a risky one based on the market returns, as follows:
|
Asset |
Expected Return (E(R)) |
Risk (σ2) |
Weights |
|
Risk-Free |
rf |
O |
W1 |
|
Risky Asset |
E(Ri) |
σ > 0 |
1- W1 |
The expected return on this portfolio would be:

The total risk of the portfolio would be:

Since, W1=0, this equation can also be written as:

j. With the help of the above equation, we can derive the capital allocation line, as follows:
From the equation for the portfolio variance, as derived above, we can find the value of portfolio standard deviation:

Thus, the weight of risk-free asset in the portfolio should be:

Now, the equation for the portfolio expected return is:

Inserting the value of W1 into the above equation, we get:

or,
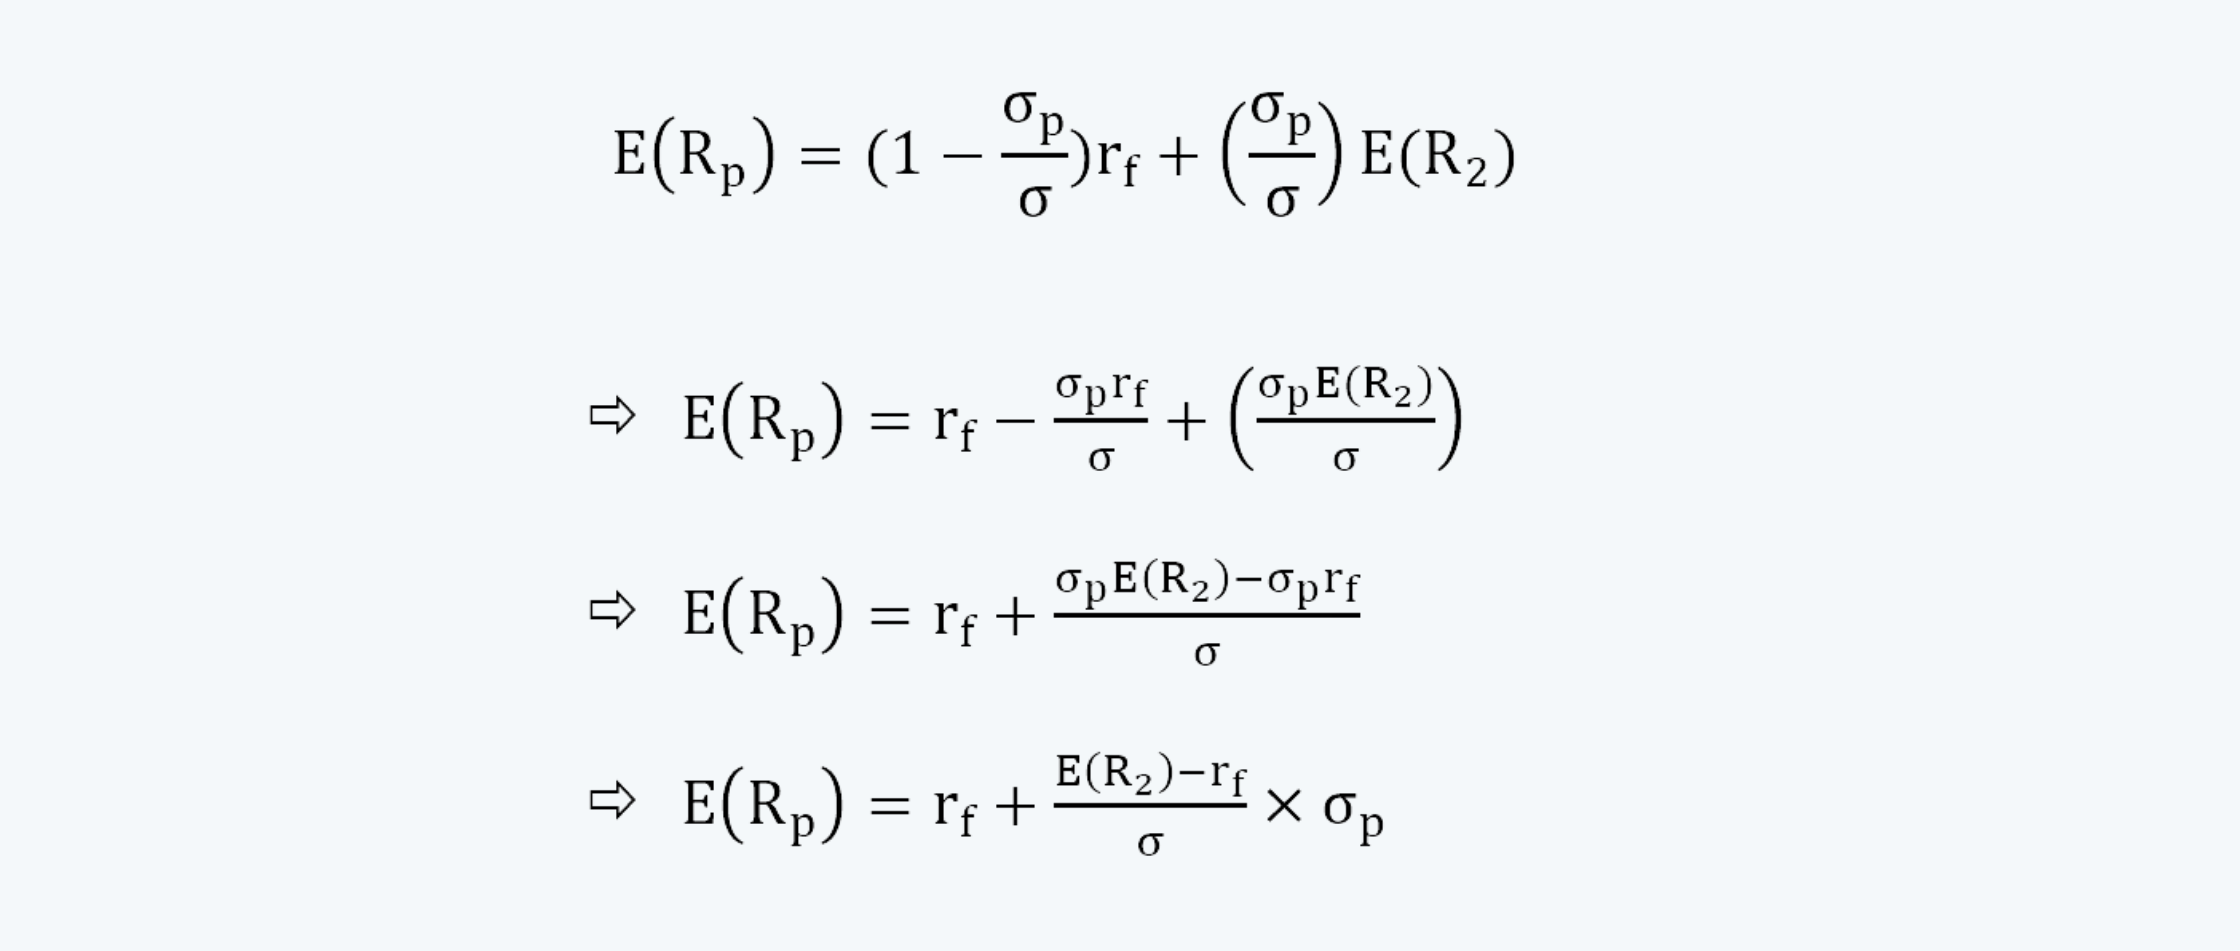
This is the equation for the capital allocation line.

The slope of the line in the above equation represents the market price of the risk.
k. Now if we draw the indifference curves and capital allocation lines on the same graph, it would look like this:
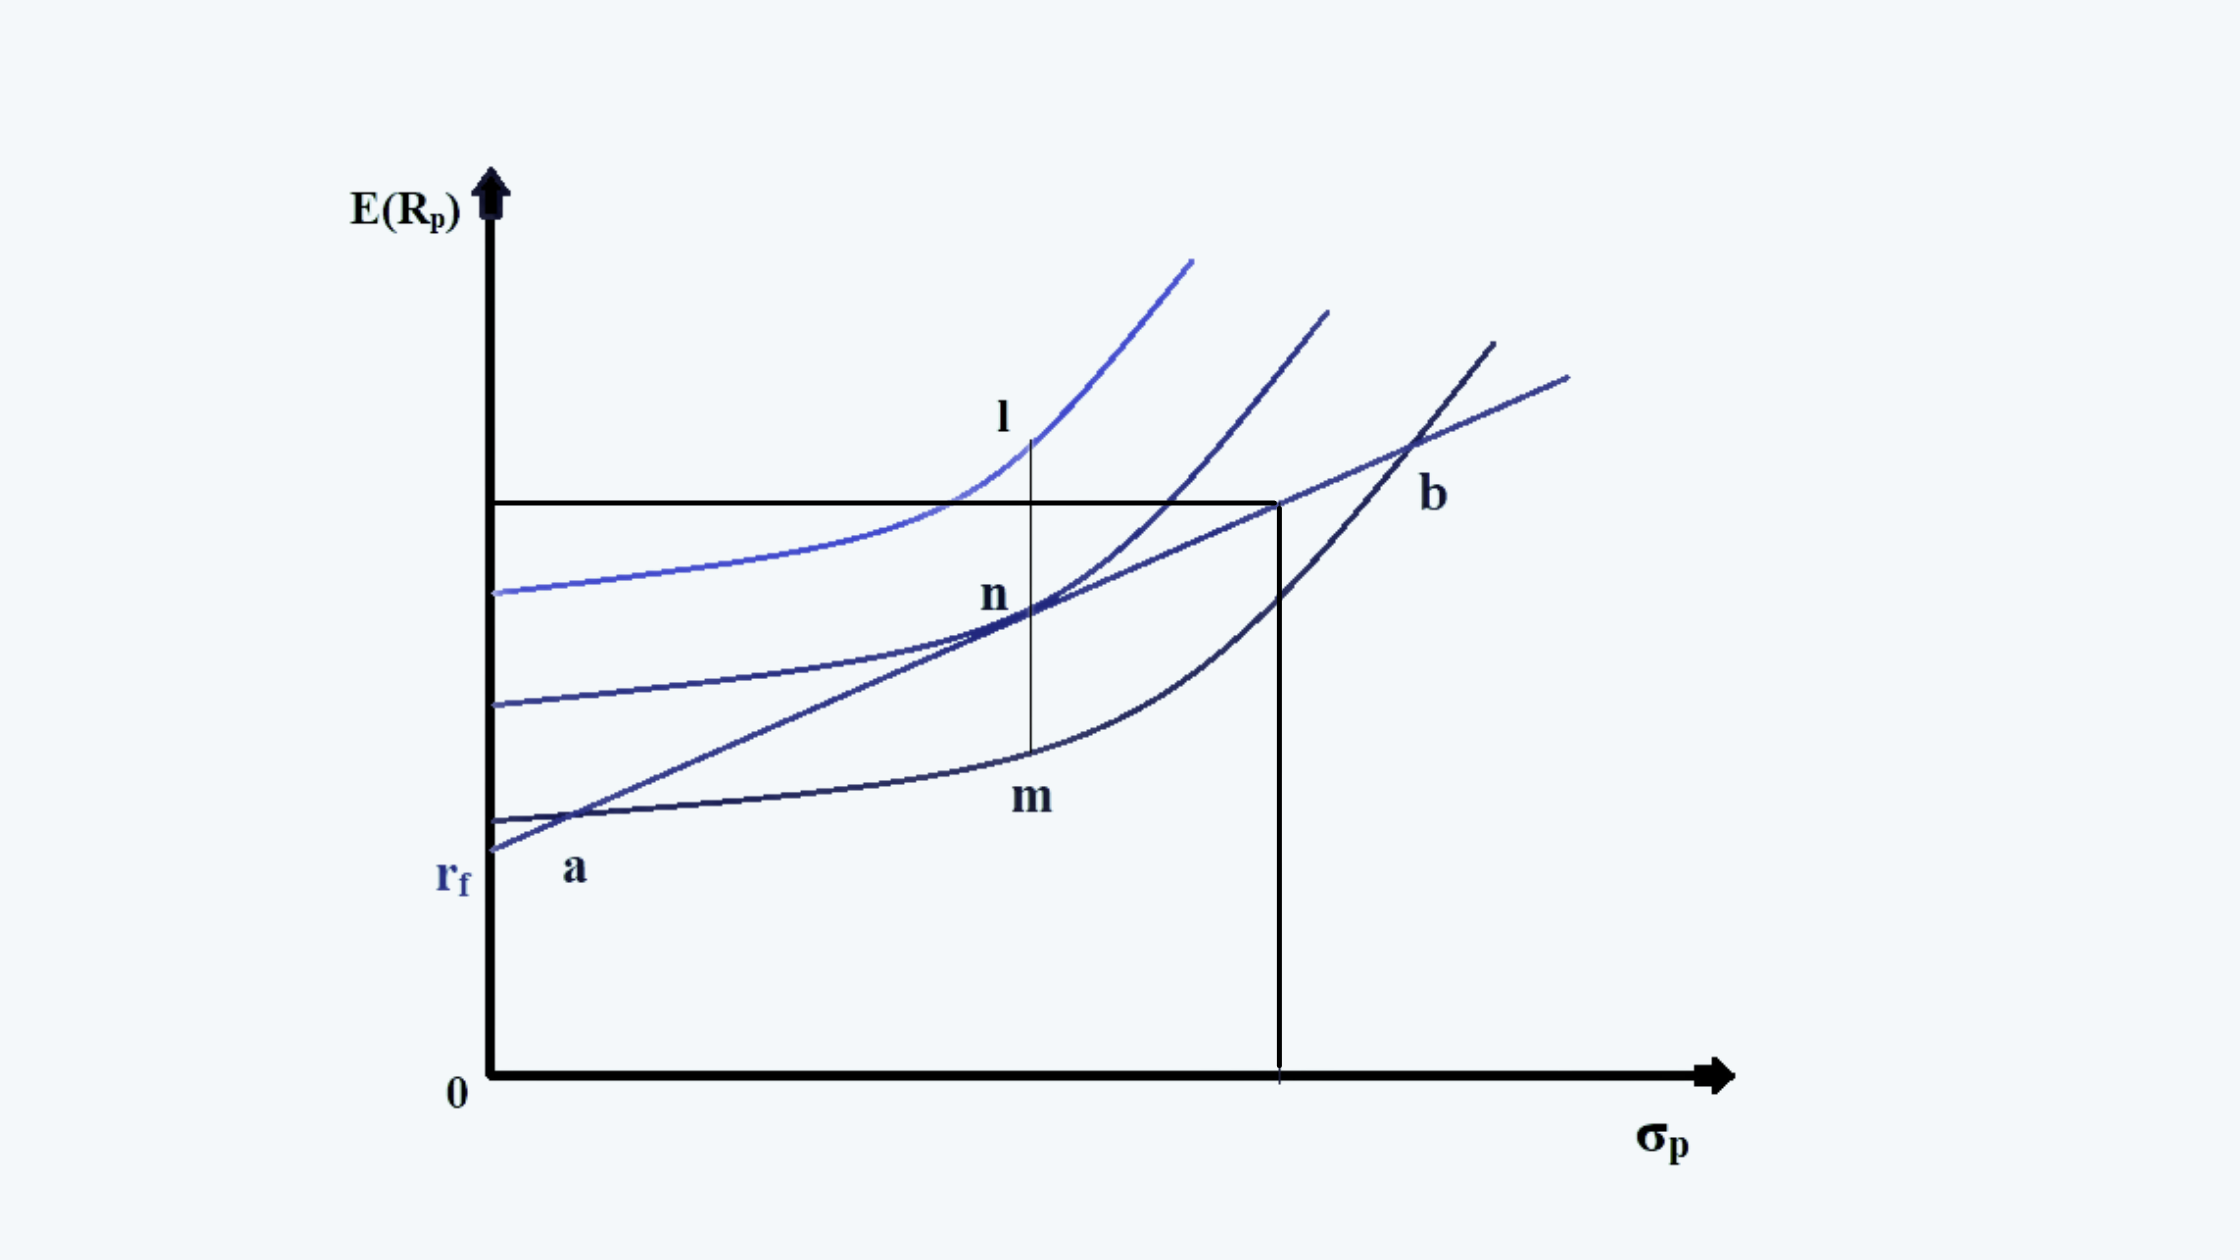
In the above figure, we have three indifference curves and a capital allocation line. The higher the indifference curve, the better utility/satisfaction it provides to the investor. The capital allocation line shows the maximum amount of return that an investor can have, and the maximum risk it can tolerate.
We can consider different points for the optimal allocation as follows:
i. Point ‘m’ lies below the capital allocation line, which means, that the investor has a higher risk tolerance, which can help him earn better returns. Thus this point is not the desired position for the investor to be at.
ii. Point ‘l’ lies above the capital allocation line, thus it is unachievable.
iii. Point ‘a’ and ‘b’ lies on the capital allocation line, but they lie on the lower indifference curve, in comparison to the other points on the line that can be on higher indifference curves. Thus, these points provide lesser utility to the investor.
iv. Point ‘m’ is the tangent point between the indifference curve and the capital allocation line. It shows the highest indifference curve that can be achieved given the risk tolerance, as shown by the capital allocation line. Thus, this point provides the maximum utility.
Thus, point ‘m’ is the optimal portfolio position for the investor.
l. For different individual investors, the position of the indifference curve could be different over the same capital allocation line.
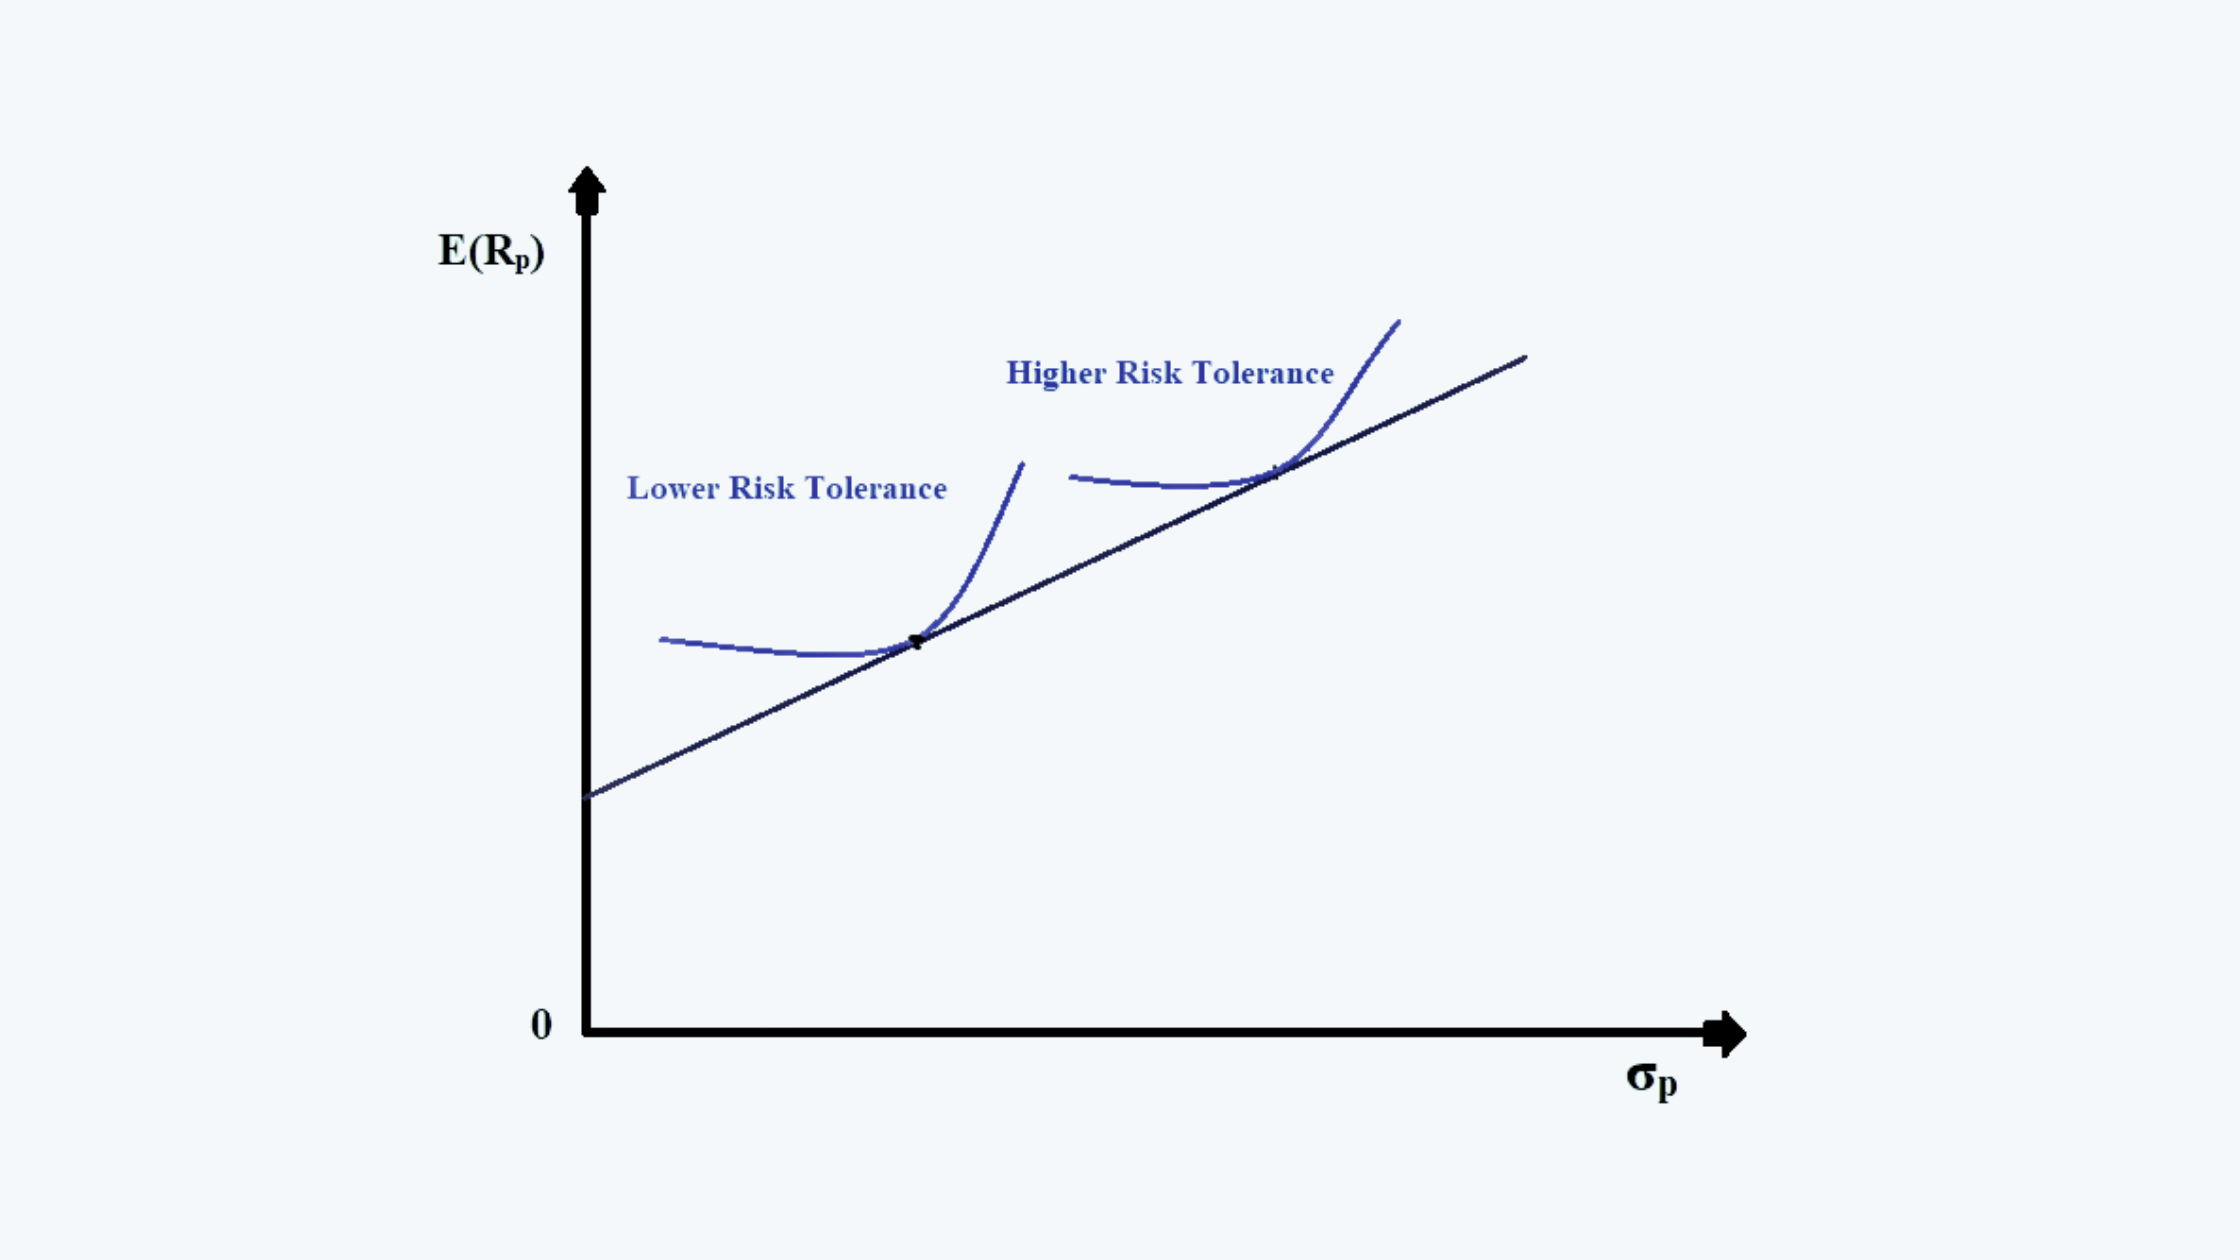
The individuals with the higher risk tolerance would have their indifference curves further right, in comparison to those with a lower tolerance. This is mainly because of higher expected returns, with greater risk acceptance.