Course Content
PORTFOLIO MANAGEMENT: AN OVERVIEW
This topic is covered in study session 18 of the material provided by the Institute. After reading this chapter, a student shall be able to: a. describe the portfolio approach to investing; b. describe the steps in the portfolio management process; c. describe types of investors and distinctive characteristics and needs of each; d. describe defined contribution and defined benefit pension plans; e. describe aspects of the asset management industry; f. describe mutual funds and compare them with other pooled investment products.
0/6
PORTFOLIO RISK AND RETURN: PART I
This topic is covered in study session 18 of the material provided by the institute. After reading this chapter, a student shall be able to: a. calculate and interpret major return measures and describe their appropriate uses; b. compare the money-weighted and time-weighted rates of return and evaluate the performance of portfolios based on these measures; c. describe characteristics of the major asset classes that investors consider in forming portfolios; d. calculate and interpret the mean, variance, and covariance (or correlation) of asset returns based on historical data; e. explain risk aversion and its implications for portfolio selection; f. calculate and interpret portfolio standard deviation; g. describe the effect on a portfolio’s risk of investing in assets that are less than perfectly correlated; h. describe and interpret the minimum-variance and efficient frontiers of risky assets and the global minimum-variance portfolio; i. explain the selection of an optimal portfolio, given an investor’s utility (or risk aversion) and the capital allocation line.
0/6
PORTFOLIO RISK AND RETURN: PART II
This topic is covered in study session 18 of the material provided by the institute. After reading this chapter, a student shall be able to: a. describe the implications of combining a risk-free asset with a portfolio of risky assets; b. explain the capital allocation line (CAL) and the capital market line (CML); c. explain systematic and nonsystematic risk, including why an investor should not expect to receive an additional return for bearing nonsystematic risk; d. explain return-generating models (including the market model) and their uses; e. calculate and interpret beta; f. explain the capital asset pricing model (CAPM), including its assumptions, and the security market line (SML); g. calculate and interpret the expected return of an asset using the CAPM; h. describe and demonstrate applications of the CAPM and the SML. i. calculate and interpret the Sharpe ratio, Treynor ratio, M2, and Jensen’s alpha.
0/7
BASICS OF PORTFOLIO PLANNING AND CONSTRUCTION
This topic is covered in study session 19 of the material provided by the institute. After reading this chapter, a student shall be able to: a. describe the reasons for a written investment policy statement (IPS); b. describe the major components of an IPS; c. describe risk and return objectives and how they may be developed for a client; d. distinguish between the willingness and the ability (capacity) to take risk in analyzing an investor’s financial risk tolerance; e. describe the investment constraints of liquidity, time horizon, tax concerns, legal and regulatory factors, and unique circumstances and their implications for the choice of portfolio assets; f. explain the specification of asset classes in relation to asset allocation; g. describe the principles of portfolio construction and the role of asset allocation in relation to the IPS. h. describe how environmental, social, and governance (ESG) considerations may be integrated into portfolio planning and construction.
0/5
INTRODUCTION TO RISK MANAGEMENT
This topic is covered in study session 19 of the material provided by the institute. After reading this chapter, a student shall be able to: a. define risk management; b. describe features of a risk management framework; c. define risk governance and describe elements of effective risk governance; d. explain how risk tolerance affects risk management; e. describe risk budgeting and its role in risk governance; f. identify financial and non-financial sources of risk and describe how they may interact; g. describe methods for measuring and modifying risk exposures and factors to consider in choosing among the methods.
0/7
TECHNICAL ANALYSIS
This topic is covered in study session 19 of the material provided by the institute. After reading this chapter, a student shall be able to: a. explain principles of technical analysis, its applications, and its underlying assumptions; b. describe the construction of different types of technical analysis charts and interpret them; c. explain uses of trend, support, resistance lines, and change in polarity; d. describe common chart patterns; e. describe common technical analysis indicators (price-based, momentum oscillators, sentiment, and flow of funds); f. explain how technical analysts use cycles; g. describe the key tenets of Elliott Wave Theory and the importance of Fibonacci numbers; h. describe intermarket analysis as it relates to technical analysis and asset allocation.
0/7
Portfolio Management
About Lesson

LOS F and G requires us to:

f.  calculate and interpret portfolio standard deviation
g.  describe the effect on a portfolio’s risk of investing in assets that are less than perfectly correlated

a.  As discussed, the portfolio returns and the portfolio standard deviation can be calculated using the formulas:

portfolio returns and portfolio standard deviation formula Portfolio Management CFA level 1 Study Notes

Here ρ1,2 is the correlation between the two securities. It determines the effect on portfolio risk when two or more assets are combined.

b.  For example, if there is a perfect correlation between the two securities in a two-security portfolio, i.e. ρ1,2=1, then

perfect correlation between securities Portfolio Management CFA level 1 Study Notes

Thus, in the case of perfect correlation, the standard deviation of the portfolio is nothing but the weighted average of the individual risk.

c.  Now, let us consider a case of less than perfect correlation between the two assets in a two-asset portfolio, i.e. ρ1,2<1, then

2W1W2 ρ1,2 σ1 σ2 < 2W1W2 σ1 σ2

and, the first part of the equation (i.e. W12σ12 + W22σ22 ) remains the same. Thus, the standard deviation of the portfolio, with perfect correlation is less than the standard deviation of the portfolio with less than perfect correlation.

d.  We can explain this with the help of an example:

Suppose there is a two-asset portfolio with both the assets having a return of 10%, a standard deviation of 20%, and equal weight.

     i.  Now, if the correlation coefficient of the two assets is one, i.e. ρ1,2=1, then:

Rp = 0.5 × 0.10 + 0.5 × 0.10

Rp = 0.10 or 10%

And,

σp2 = (0.5)2 × (0.2)2 + (0.5)2 × (0.2)2 + 2 × 0.5 × 0.5 × 1 × 0.2 × 0.2

σp = 0.20 or 20%

    ii.  If there is no correlation between the two assets in the portfolio, e. ρ1,2=0, then:

Rp = 0.5 × 0.10 + 0.5 × 0.10

Rp = 0.10 or 10%

And,

σp2 = (0.5)2 × (0.2)2 + (0.5)2 × (0.2)2 + 2 × 0.5 × 0.5 × 0 × 0.2 × 0.2

σp = (0.02)1/2 or 14.14%

   iii.  Now, if the correlation coefficient of the two assets is a negative one, i.e. ρ1,2= -1, then:

Rp = 0.5 × 0.10 + 0.5 × 0.10

Rp = 0.10 or 10%

However, in the real world, if there are two assets in a portfolio, which are perfectly negatively correlated, having equal weights, then the returns of that portfolio should be zero.

And,

σp2 = (0.5)2 × (0.2)2 + (0.5)2 × (0.2)2 + 2 × 0.5 × 0.5 × (1) × 0.2 × 0.2

σp = 0

e.  Suppose we have another portfolio with two assets, Asset A and Asset B, as follows:

Asset

Returns (E(Ri))

Risk (σi)

A

10%

15%

B

15%

20%

The relationship between the two assets, at different levels of asset correlation, is:

Weight in Asset A

Portfolio Return

Portfolio Risk with Correlation of

1

0.5

0.2

-1

0

15.00%

20.00%

20.00%

20.00%

20.00%

0.1

14.50%

19.47%

17.91%

16.97%

13.23%

0.2

14.00%

18.94%

16.17%

14.51%

7.86%

0.3

13.50%

18.42%

14.79%

12.60%

3.88%

0.4

13.00%

17.91%

13.76%

11.26%

1.29%

0.5

12.50%

17.41%

13.08%

10.48%

0.09%

0.6

12.00%

16.91%

12.76%

10.26%

0.29%

0.7

11.50%

16.42%

12.79%

10.60%

1.88%

0.8

11.00%

15.94%

13.17%

11.51%

4.86%

0.9

10.50%

15.47%

13.91%

12.97%

9.23%

1

10.00%

15.00%

15.00%

15.00%

15.00%

The above information, when plotted on a graph, would look like this:

Risk and Return for Different Values of ρ Portfolio Management CFA level 1 Study Notes


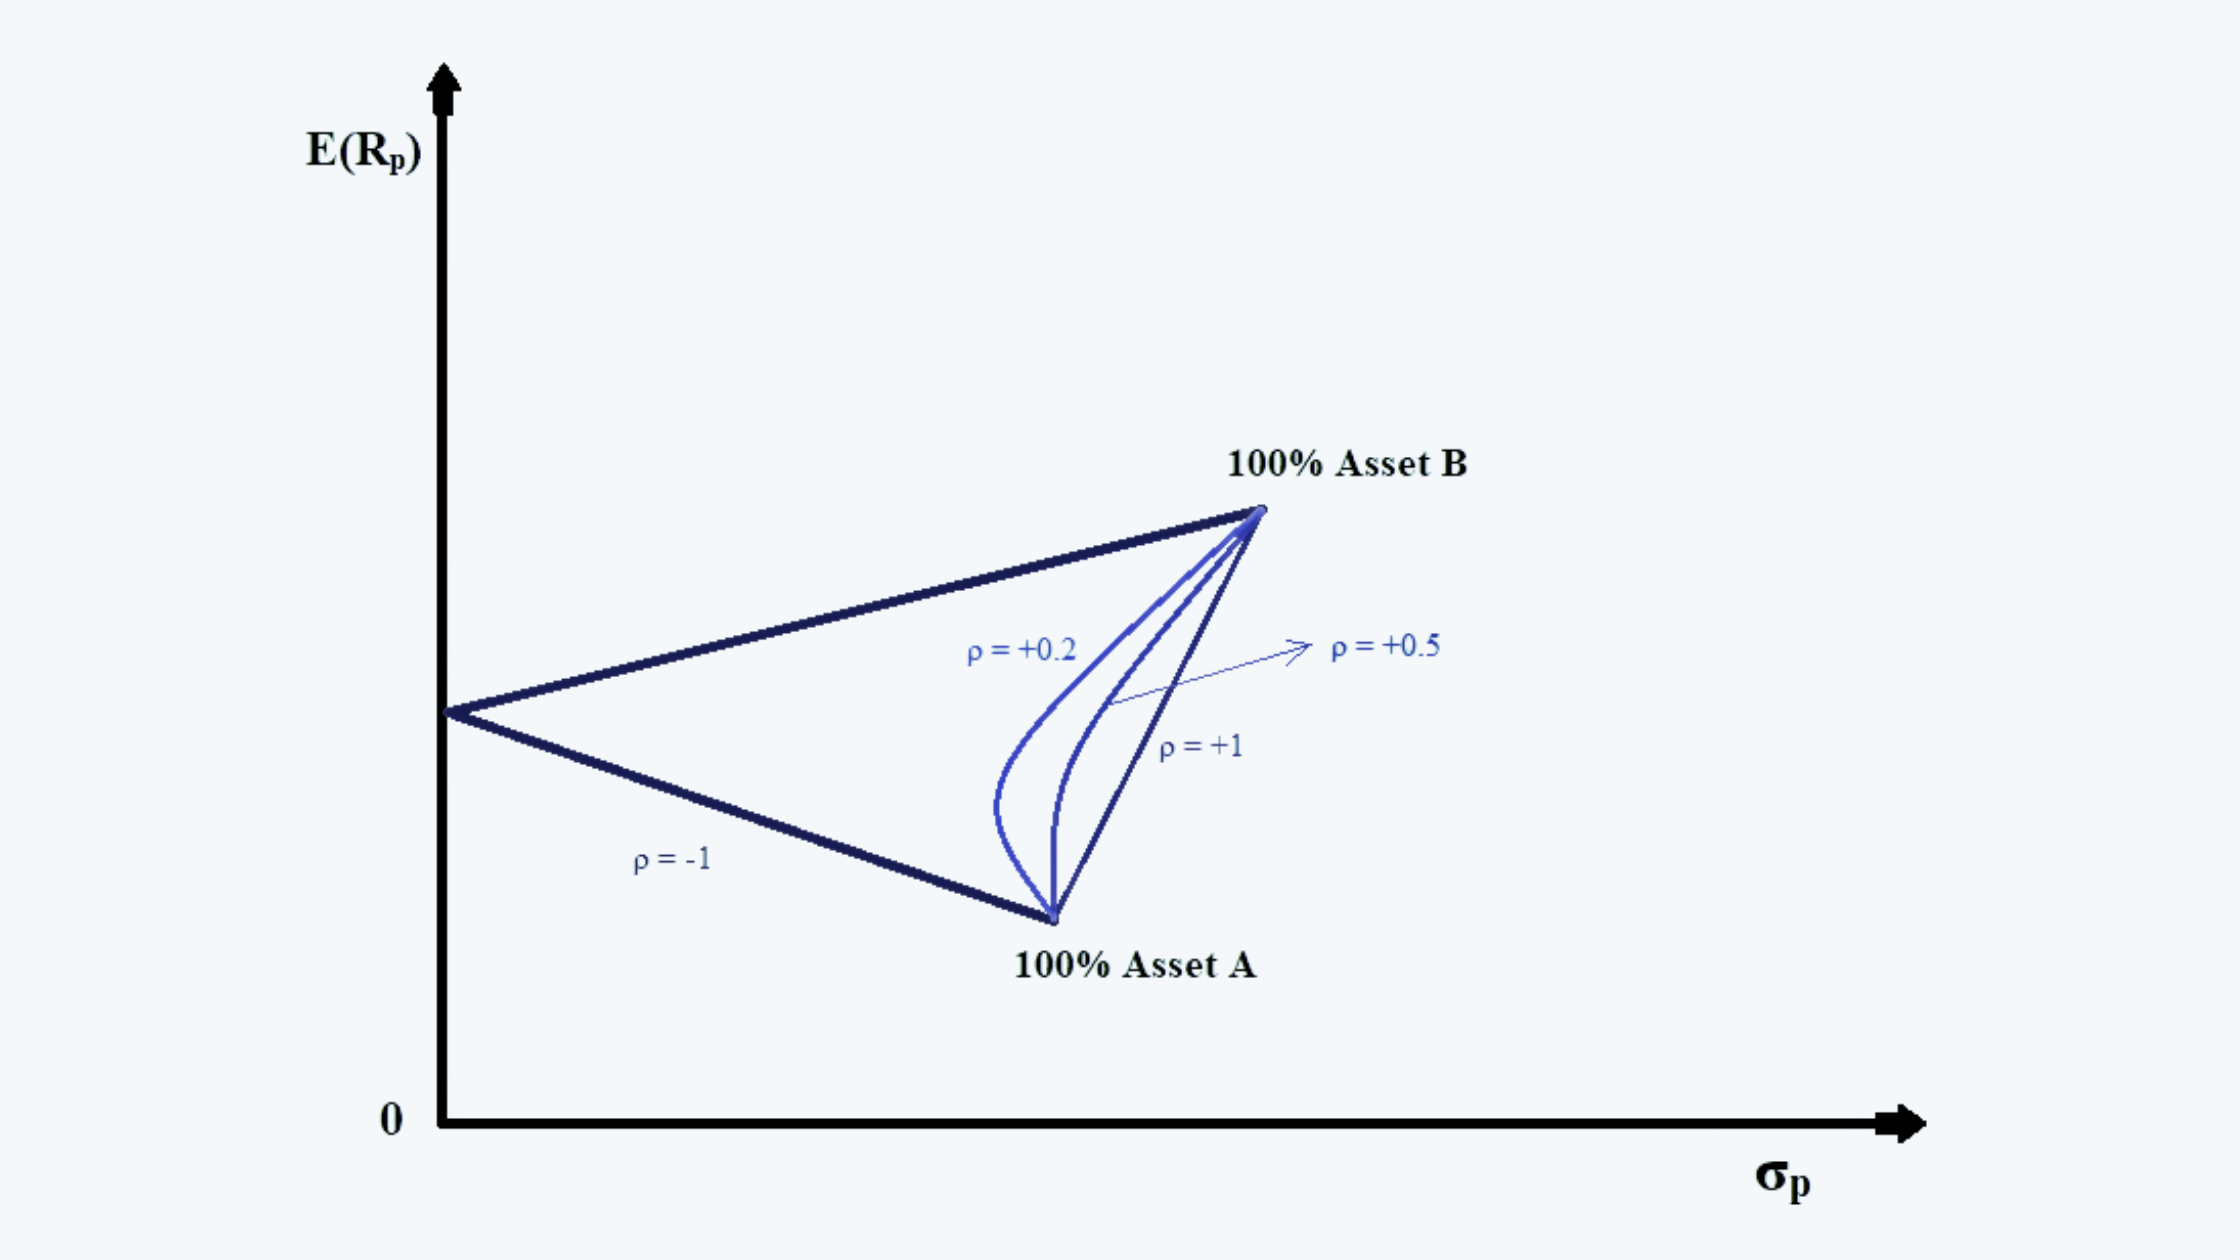
Diversification of Portfolio Risk

The portfolio risk can be reduced through diversification by the use of differently correlated assets as follows:

a.  Making an investment in a variety of assets. The diversification could be achieved by mixing a variety of assets such as stocks, bonds, cash, real estate, etc. Within the stocks, diversification could be made across the sectors such as energy or consumer goods, large-cap stocks, and small-cap stocks. The bonds could also be diversified by investing in government versus corporate bonds, etc.

b.  The portfolio could also be diversified by the use of index ETFs. This also minimizes the cost of diversification.

c.  Cross-border diversification can also help in reducing the risk through exposure to different countries and different phases of the business cycle.

d.  The key to reducing the risk through diversification is not investing in the own employer’s stocks. The pension plan should also not own the sponsor’s stock as well. This increases the concentration of risk.

e.  For the purpose of diversification, the assets should be added to the portfolio only if the risk-adjusted return benefits the portfolio. That is,

risk-adjusted return benefits Portfolio Management CFA level 1 Study Notes

f.  Another way of reducing the risk is through buying the insurance and the put options.