LOS D requires us to:
calculate and interpret the mean, variance, and covariance (or correlation) of asset returns based on historical data
There are three main measures of variance, standard deviation, and covariance. These three are discussed below.
1. Variance
a. Variance is a measure of the dispersion of returns. It is the dispersion of data from its average.
b. Variance can be calculated using the following formula:

‘Ri’, in the above equation is the return on the individual securities, and ‘µ’ represents the population parameter.
Since, generally, we do not know the population parameters, we use the sample statistics and calculate the dispersion around the average using the following formula:

2. Standard Deviation
a. The standard deviation also measures the dispersion around the mean value.
b. It is the square root of the variance.
c. The standard deviation can be calculated using the following formula:

It can also be written as:

3. Covariance and Correlation of Returns
a. Covariance measures the extent to which the two variables move over time.
b. A positive covariance is an indicator of movement in the same direction, whereas a negative covariance indicates the movement in a different Zero covariance is an indicator of no relationship in the movement of returns.
c. The covariance between different assets within a portfolio can be calculated using the following formula:
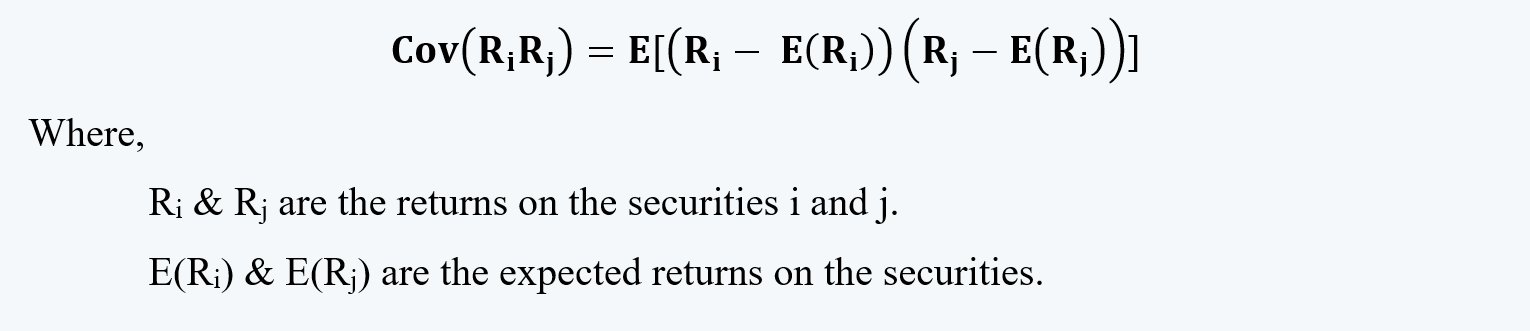
d. Another standardized measure of co-movement of the direction of the returns of the securities is a correlation.
e. It is calculated by dividing the covariance of the returns of two securities with their standard deviations, as follows:

f. The correlation coefficient of the two securities always ranges between +1 and -1.
i. A positive correlation of 1 indicates that the returns are moving proportionally in the same direction.
ii. A negative correlation of 1 indicates that the returns are moving proportionally in the opposite direction.
iii. Zero correlation is an indicator of no relationship between the return of two assets.
4. The variance of Portfolio of Assets
a. The variance of a portfolio of assets needs the variance of each asset plus the covariance of each asset within the portfolio with each other. The variances and the covariance are additive.
b. The variance of the portfolio can thus be calculated as follows:

c. Thus the portfolio variance is the sum of all the variances and covariances.
5. Example
Suppose we have a portfolio with two indexes, index A and index B, with their respective returns and risk as follows:
|
Asset |
Weights, Wi |
Expected Returns, E(Ri) |
Risk, σ2i |
|
Index A |
80% |
10% |
16% |
|
Index B |
20% |
18% |
34% |
Suppose, the covariance between the two assets (i.e. Cov(RiRj)) is 0.5%, we can now calculate the return and risk of the portfolio and the correlation between the two assets of the portfolio.
Portfolio Return
Rp = W1R1 + W2R2
= (0.80)*(0.10) + (0.20)*(0.18)
= 0.1160 or 11.6%
Portfolio Risk
σ2(Rp) = W12σ12 + W22σ22 + 2W1W2Cov(R1R2)
= (0.80)*(0.16) + (0.20)*(0.34) + 2*(0.80)*(0.20)*(0.005)
= 0.1976 or 19.76%
Correlation Between The Assets
ρ12 = [Cov(R1R2)] / [σ1 σ2]
(0.005) / (0.16 * 0.34) = 0.0919
Interpretation
We can improve make the investments by any of these three methods, i.e.:
a. by improving the returns,
b. by reducing the risks, or
c. by both increasing the returns and reducing the risks.
In the above situation, if we consider the investment only in Index A, then by adding Index B for diversification, we can increase the amount of returns.
The benefit of diversification can be achieved by adding less correlated assets to the portfolio.
6. Expected Return Vs. Historical return
a. The historical results are based on the actual returns from the past. It is usually assumed that the historical mean return is an adequate representation of the expected return.
b. The expected return, on the other hand, is the function of three things, i.e. risk-free rate, expected inflation, and the risk premium.
Other Investment Characteristics
The other investment characteristics that need to be considered before making any investment decision are skewness and kurtosis. These are discussed in detail in Quants. For details, click here.