Course Content
PORTFOLIO MANAGEMENT: AN OVERVIEW
This topic is covered in study session 18 of the material provided by the Institute. After reading this chapter, a student shall be able to: a. describe the portfolio approach to investing; b. describe the steps in the portfolio management process; c. describe types of investors and distinctive characteristics and needs of each; d. describe defined contribution and defined benefit pension plans; e. describe aspects of the asset management industry; f. describe mutual funds and compare them with other pooled investment products.
0/6
PORTFOLIO RISK AND RETURN: PART I
This topic is covered in study session 18 of the material provided by the institute. After reading this chapter, a student shall be able to: a. calculate and interpret major return measures and describe their appropriate uses; b. compare the money-weighted and time-weighted rates of return and evaluate the performance of portfolios based on these measures; c. describe characteristics of the major asset classes that investors consider in forming portfolios; d. calculate and interpret the mean, variance, and covariance (or correlation) of asset returns based on historical data; e. explain risk aversion and its implications for portfolio selection; f. calculate and interpret portfolio standard deviation; g. describe the effect on a portfolio’s risk of investing in assets that are less than perfectly correlated; h. describe and interpret the minimum-variance and efficient frontiers of risky assets and the global minimum-variance portfolio; i. explain the selection of an optimal portfolio, given an investor’s utility (or risk aversion) and the capital allocation line.
0/6
PORTFOLIO RISK AND RETURN: PART II
This topic is covered in study session 18 of the material provided by the institute. After reading this chapter, a student shall be able to: a. describe the implications of combining a risk-free asset with a portfolio of risky assets; b. explain the capital allocation line (CAL) and the capital market line (CML); c. explain systematic and nonsystematic risk, including why an investor should not expect to receive an additional return for bearing nonsystematic risk; d. explain return-generating models (including the market model) and their uses; e. calculate and interpret beta; f. explain the capital asset pricing model (CAPM), including its assumptions, and the security market line (SML); g. calculate and interpret the expected return of an asset using the CAPM; h. describe and demonstrate applications of the CAPM and the SML. i. calculate and interpret the Sharpe ratio, Treynor ratio, M2, and Jensen’s alpha.
0/7
BASICS OF PORTFOLIO PLANNING AND CONSTRUCTION
This topic is covered in study session 19 of the material provided by the institute. After reading this chapter, a student shall be able to: a. describe the reasons for a written investment policy statement (IPS); b. describe the major components of an IPS; c. describe risk and return objectives and how they may be developed for a client; d. distinguish between the willingness and the ability (capacity) to take risk in analyzing an investor’s financial risk tolerance; e. describe the investment constraints of liquidity, time horizon, tax concerns, legal and regulatory factors, and unique circumstances and their implications for the choice of portfolio assets; f. explain the specification of asset classes in relation to asset allocation; g. describe the principles of portfolio construction and the role of asset allocation in relation to the IPS. h. describe how environmental, social, and governance (ESG) considerations may be integrated into portfolio planning and construction.
0/5
INTRODUCTION TO RISK MANAGEMENT
This topic is covered in study session 19 of the material provided by the institute. After reading this chapter, a student shall be able to: a. define risk management; b. describe features of a risk management framework; c. define risk governance and describe elements of effective risk governance; d. explain how risk tolerance affects risk management; e. describe risk budgeting and its role in risk governance; f. identify financial and non-financial sources of risk and describe how they may interact; g. describe methods for measuring and modifying risk exposures and factors to consider in choosing among the methods.
0/7
TECHNICAL ANALYSIS
This topic is covered in study session 19 of the material provided by the institute. After reading this chapter, a student shall be able to: a. explain principles of technical analysis, its applications, and its underlying assumptions; b. describe the construction of different types of technical analysis charts and interpret them; c. explain uses of trend, support, resistance lines, and change in polarity; d. describe common chart patterns; e. describe common technical analysis indicators (price-based, momentum oscillators, sentiment, and flow of funds); f. explain how technical analysts use cycles; g. describe the key tenets of Elliott Wave Theory and the importance of Fibonacci numbers; h. describe intermarket analysis as it relates to technical analysis and asset allocation.
0/7
Portfolio Management
About Lesson

LOS F and G require us to:

f.  explain how technical analysts use cycles
g.  describe the key tenets of Elliott Wave Theory and the importance of Fibonacci numbers


Over the centuries, technicians have noted recurring cycles of various frequencies in the capital markets. The study of cycles in the markets is part of broader cycle studies that exist in numerous fields of study.

1.  Kondratieff Wave

a.  The longest of the widely recognized cycles was identified by Nikolai Kondratieff in the 1920s.

b.  Kondratieff was an economist in the Soviet Union who suggested that Western economies had a 54-year cycle. He traced cycles from the 1780s to the time he published this theory in the 1920s, and the economic depression of the 1930s was consistent with the cycle he identified.

c.  His theory was mainly tied to economic cycles and commodity prices, but cycles can also be seen in the prices of equities during the time of his work.

2.  18-Year Cycle

a.  The 18-year cycle is interesting because three 18-year cycles make up the longer 54-year Kondratieff Wave.

b.  The 18-year cycle is most often mentioned in connection with real estate prices, but it can also be found in equities and other markets.

3.  Decennial Pattern

a.  The decennial pattern is the pattern of average stock market returns (based on the DJIA) broken down on the basis of the last digit in the year.

b.  Years ending with a 0 have had the worst performance, and years ending with a 5 have been by far the best.

c.  The DJIA was up every year ending in a 5 from 1885 until 1995, but it declined 0.6% in 2005.

4.  Presidential Cycle

a.  This cycle in the United States connects the performance of the DJIA with presidential elections. In this theory, years are grouped into categories on the basis of whether they were election years or the first, second, or third year following an election.

b.  The third year is the year prior to the next election. The third-year shows the best performance; in fact, the DJIA experienced a positive return in every pre-election year from 1943 through 2007.

c.  One explanation for this outcome is that with so many politicians up for re-election, they inject stimulus into the economy in an attempt to improve their chances to be re-elected.

d.  Election years are also usually positive years for the stock market, but with less consistency. Post-election years and the so-called midterm year have the worst performance.

5.  Elliot Wave Theory

a.  In a theory proposed by R.N. Elliott in 1938, the market moves in regular, repeated waves or cycles. He identified and categorized these waves and wrote in detail about aspects of market cycles.

b.  In the most basic form, the theory says that the stock market follows a repetitive rhythm of a five-wave advance followed by a three-wave decline.

c.  Consider the following figure:

Elliott Wave Theory Quantitative Methods CFA level 1 Study Notes

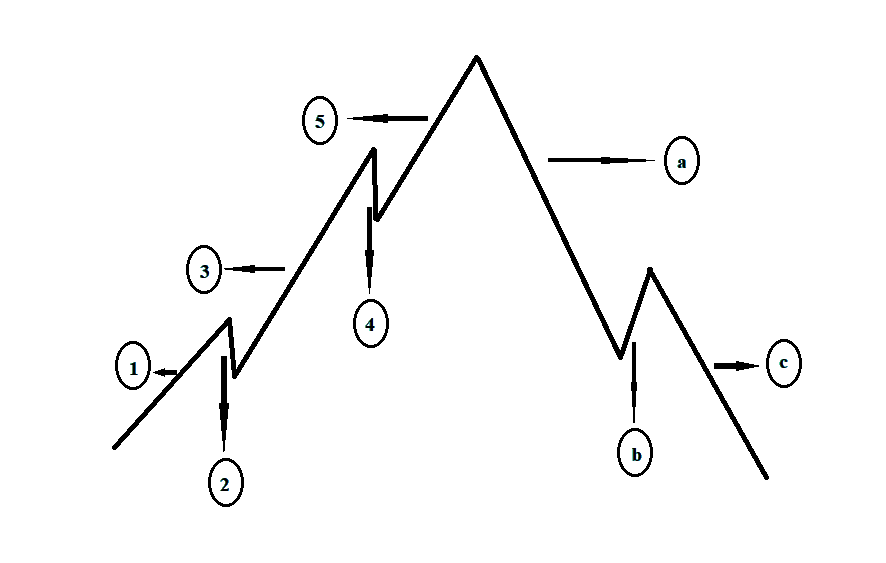
d.  Wave 1, 3, and 5 – called the impulse waves are the, while waves move against the uptrend. Waves 2 and 4 are called the corrective waves because they correct waves 1 and 3. After wave 5, the advance has been completed, a three-wave correction begins. The three corrective waves are identified as a, b and c.

i.  Wave 1 starts as a basing pattern and displays an increase in price, volume, and breadth. Wave 1 consists of five smaller waves.

ii.  Wave 2 moves down, retracing much of the gain in Wave 1 but not all of it. Common percentage retracements are Fibonacci ratios, such as 50% or 62%. Wave 2 never erases all of the gains from Wave 1. Wave 2 consists of three smaller waves.

iii.  Wave 3 moves above the high of the first wave and has strong breadth, volume, and price movement. Most of the price movement in an uptrend typically occurs in Wave 3. Wave 3 consists of five smaller waves. Wave 3 often moves prices 1.68 times higher than the length of Wave 1, which is a Fibonacci ratio.

iv.  Wave 4 is, again, a correction, and the ratio of the change in price during this wave to the price change during the third wave is also generally a Fibonacci ratio. Wave 4 commonly reverses 38% of the gain in Wave 3.

v.  Wave 5 is also an up wave. Generally, the price movement in Wave 5 is not as great as that of Wave 3. The exception to the rule is that Wave 5 may become extended, as when euphoria overtakes the market. Wave 5 consists of five smaller waves.

vi.  After Wave 5 is completed, the market traces out a series of three corrective waves, labeled a, b, and c in Exhibit 12-34.

vii.  Wave a is a down wave in a bull market; Wave itself breaks down into three waves.

viii.  Wave b is an upward movement and breaks down into five waves. Wave b is a false rally and is often called a “bull trap.”

ix.  Wave c is the final corrective wave. In a bull market, it does not move below the start of the prior wave 1 pattern. Wave c breaks down into three sub-waves.

e.  The whole cycle presented in the theory is called the grand super-cycle. For each of the grand super-cycle, there is a super-cycle.

In the super-cycle, there is a repercussion in the form of a cycle, followed by a primary, intermediate, minor, minute, minutte, and sub-minutte cycle respectively.