LOS D requires us to:
describe common chart patterns.
a. The cyclical trends in the prices are of utmost interest to the technical analyst who looks at them with a view to forecasting the trend reversal preferably in advance, or at least before the reversal is complete.
b. It can be observed that the share prices do not always switch from the bullish phase to the bearish phase or vice-versa almost overnight.
The transitional phase which lies between the two trends throws up indications as to the direction of price change.
c. The concept of price patterns is based on the invariable occurrence of a transitional phase, which shows up as an intermediate trend, in between two major trends.
d. In a rising market, the prices increase as the buyer’s optimism about the market outweighs the cautiousness of the sellers. The uptrend subsequently slows down either because buyers are booking gains, or because the balance tends to get even with sellers exerting more pressure.
At the end of this exercise, the market continues to surge ahead or turn down due to increased selling pressure.
e. There are two types of chart patterns, i.e. reversal pattern and continuation pattern.
Reversal Pattern
a. Reversal patterns indicate the trends that reverse once the pattern is complete.
b. The term ‘reversal’ actually refers to the trend of the stock before the development of the pattern. I order to have some predictive value from the pattern, there should be a clear preceding clear distinguishable trend.
Head-and-Shoulder Pattern
a. The most common reversal pattern is ‘head-and-shoulder-pattern’.
b. Head-and-shoulder is a price chart pattern with two short peaks on either side of a large peak resembling the head and shoulders of a person.
c. As the price moves down from the head to the right shoulder, it is regarded as a signal for a further fall in prices.
d. The line that joins the points from where the final rally (head) begins and ends is called the neckline
e. In the reverse pattern, the head and shoulders forming below the line, when the price in the right shoulder has touched the baseline, it is a signal for a continued rise.
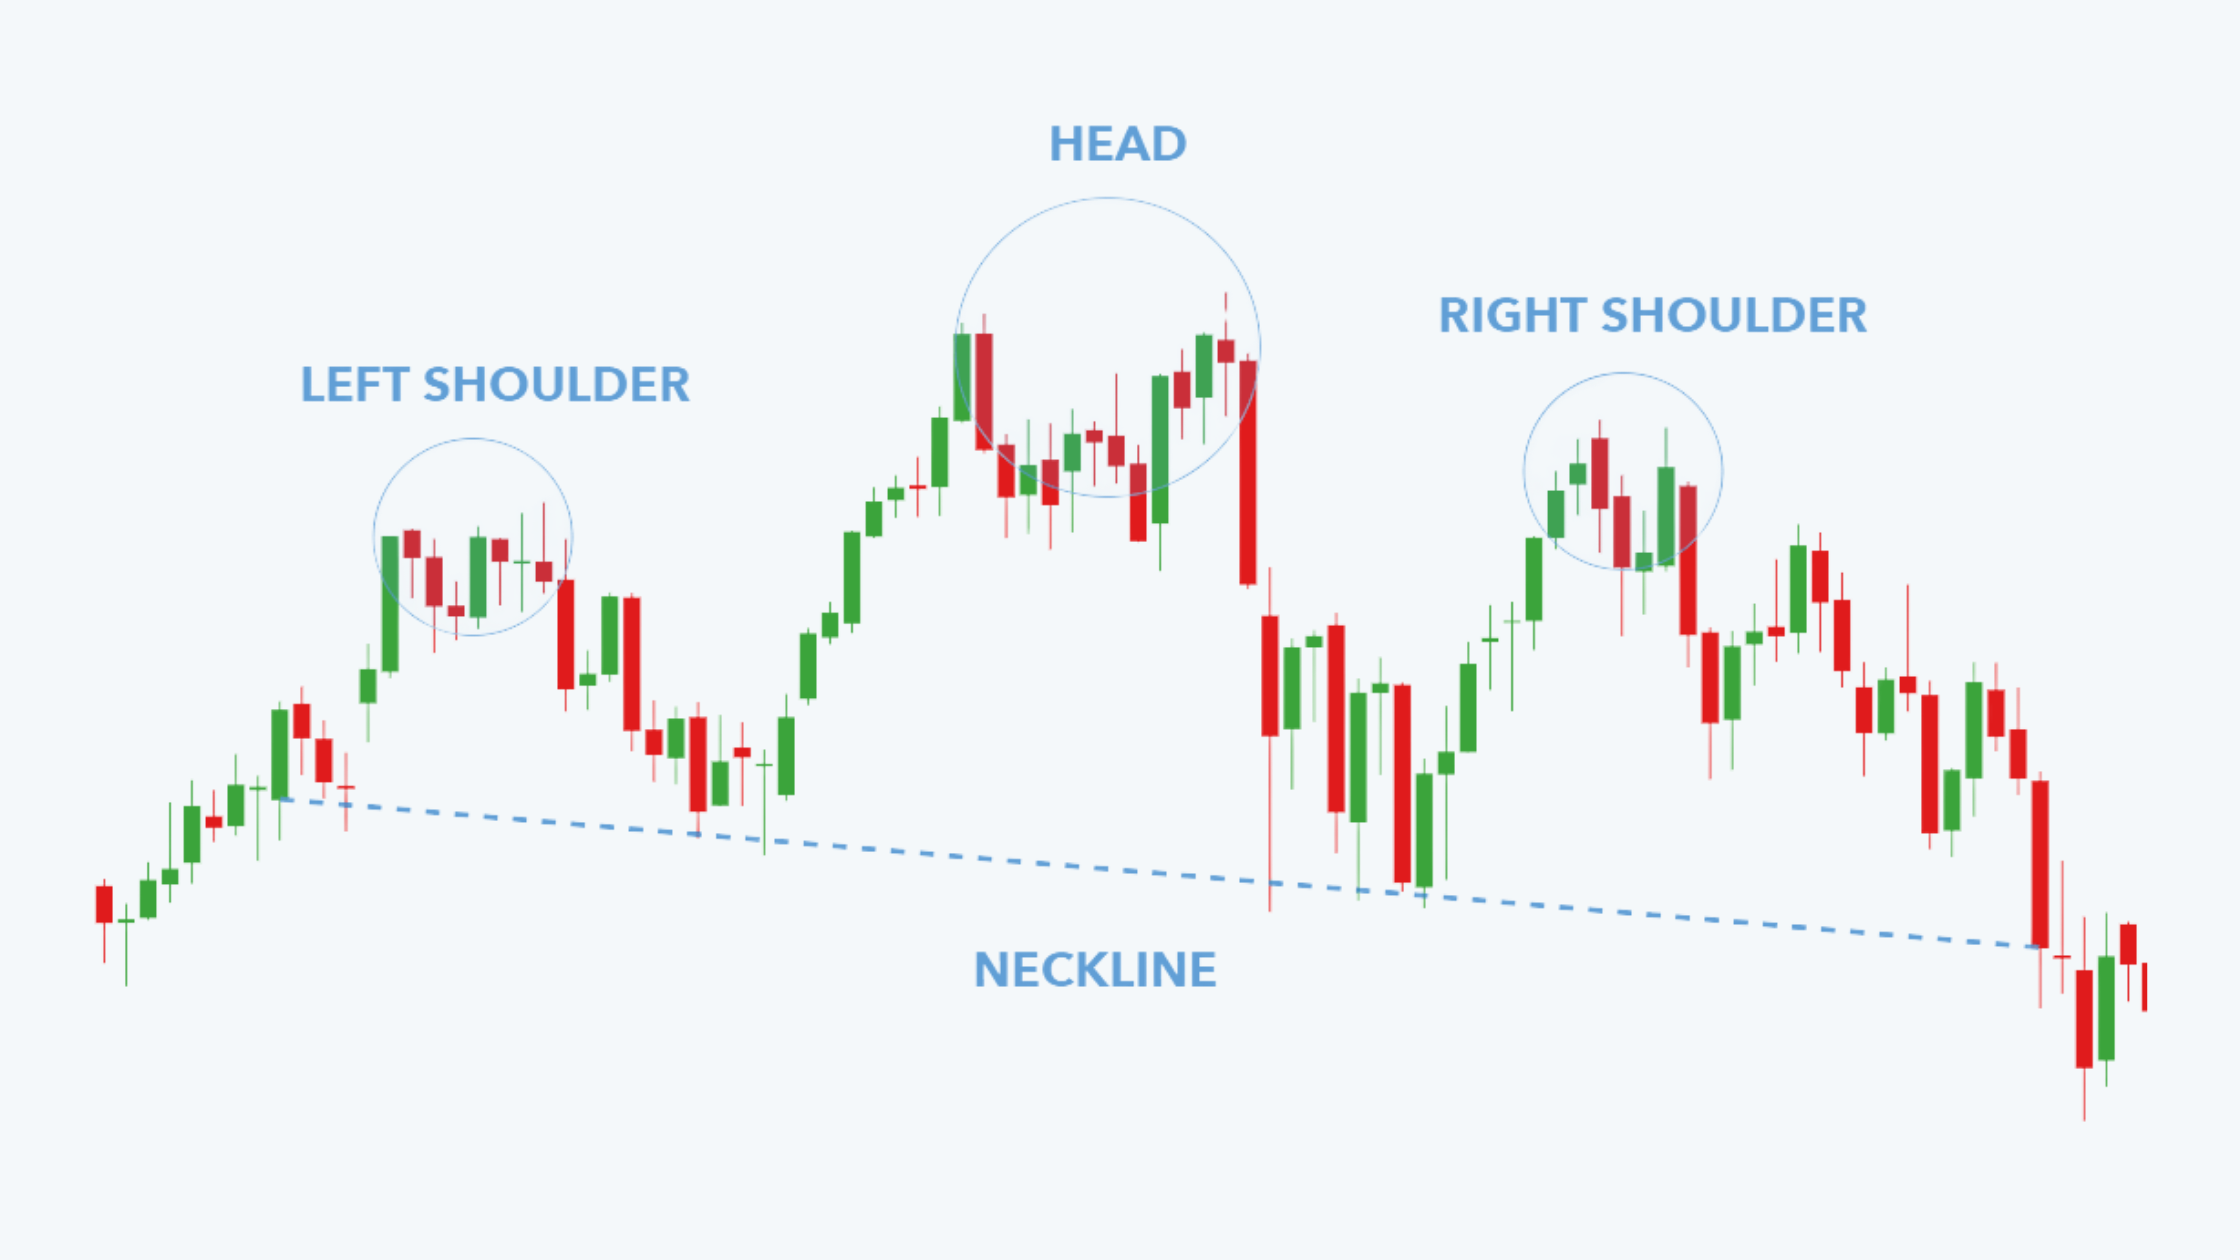
f. In reality, however, the head and shoulders may not always be symmetrical. This does not, in any way, alter the signals provided by the pattern. The important requirement is that the shoulders should be lower level than the head.
g. The left shoulder signifies the penultimate rally in the bull market. The right shoulder confirms the beginning of a bear market, as it fails to climb above the previous rally (the head).
h. The head in the above pattern is the second peak and the highest point in the pattern. Neither the left shoulder nor the right one exceeds the head. In order to profit from security that exhibits a head and shoulder pattern, a price equal to the following should be set:
Target Price = Neckline – (Head – Neckline)
It is desirable to close the position in the security at this target price because after that point the price starts to stumble.
i. The formation is easily discernable, once the right shoulder is formed.
j. A trend reversal almost always occurs when the neckline is penetrated by the price line. The technical analyst sells when the price falls at least by 3% from the point of penetration of neckline. The possibility of the price line hovering around the neckline, or rising after a penetration, is very rare making this pattern the most reliable indicator of the onset of a bear market.
k. Volume characteristics have to confirm the reversal signaled by the head and shoulders formation. Volume is very heavy at the left shoulder and continues to rise, albeit at a very lower rate at the head. The formation of the right shoulder is accompanied by a noticeably low volume.
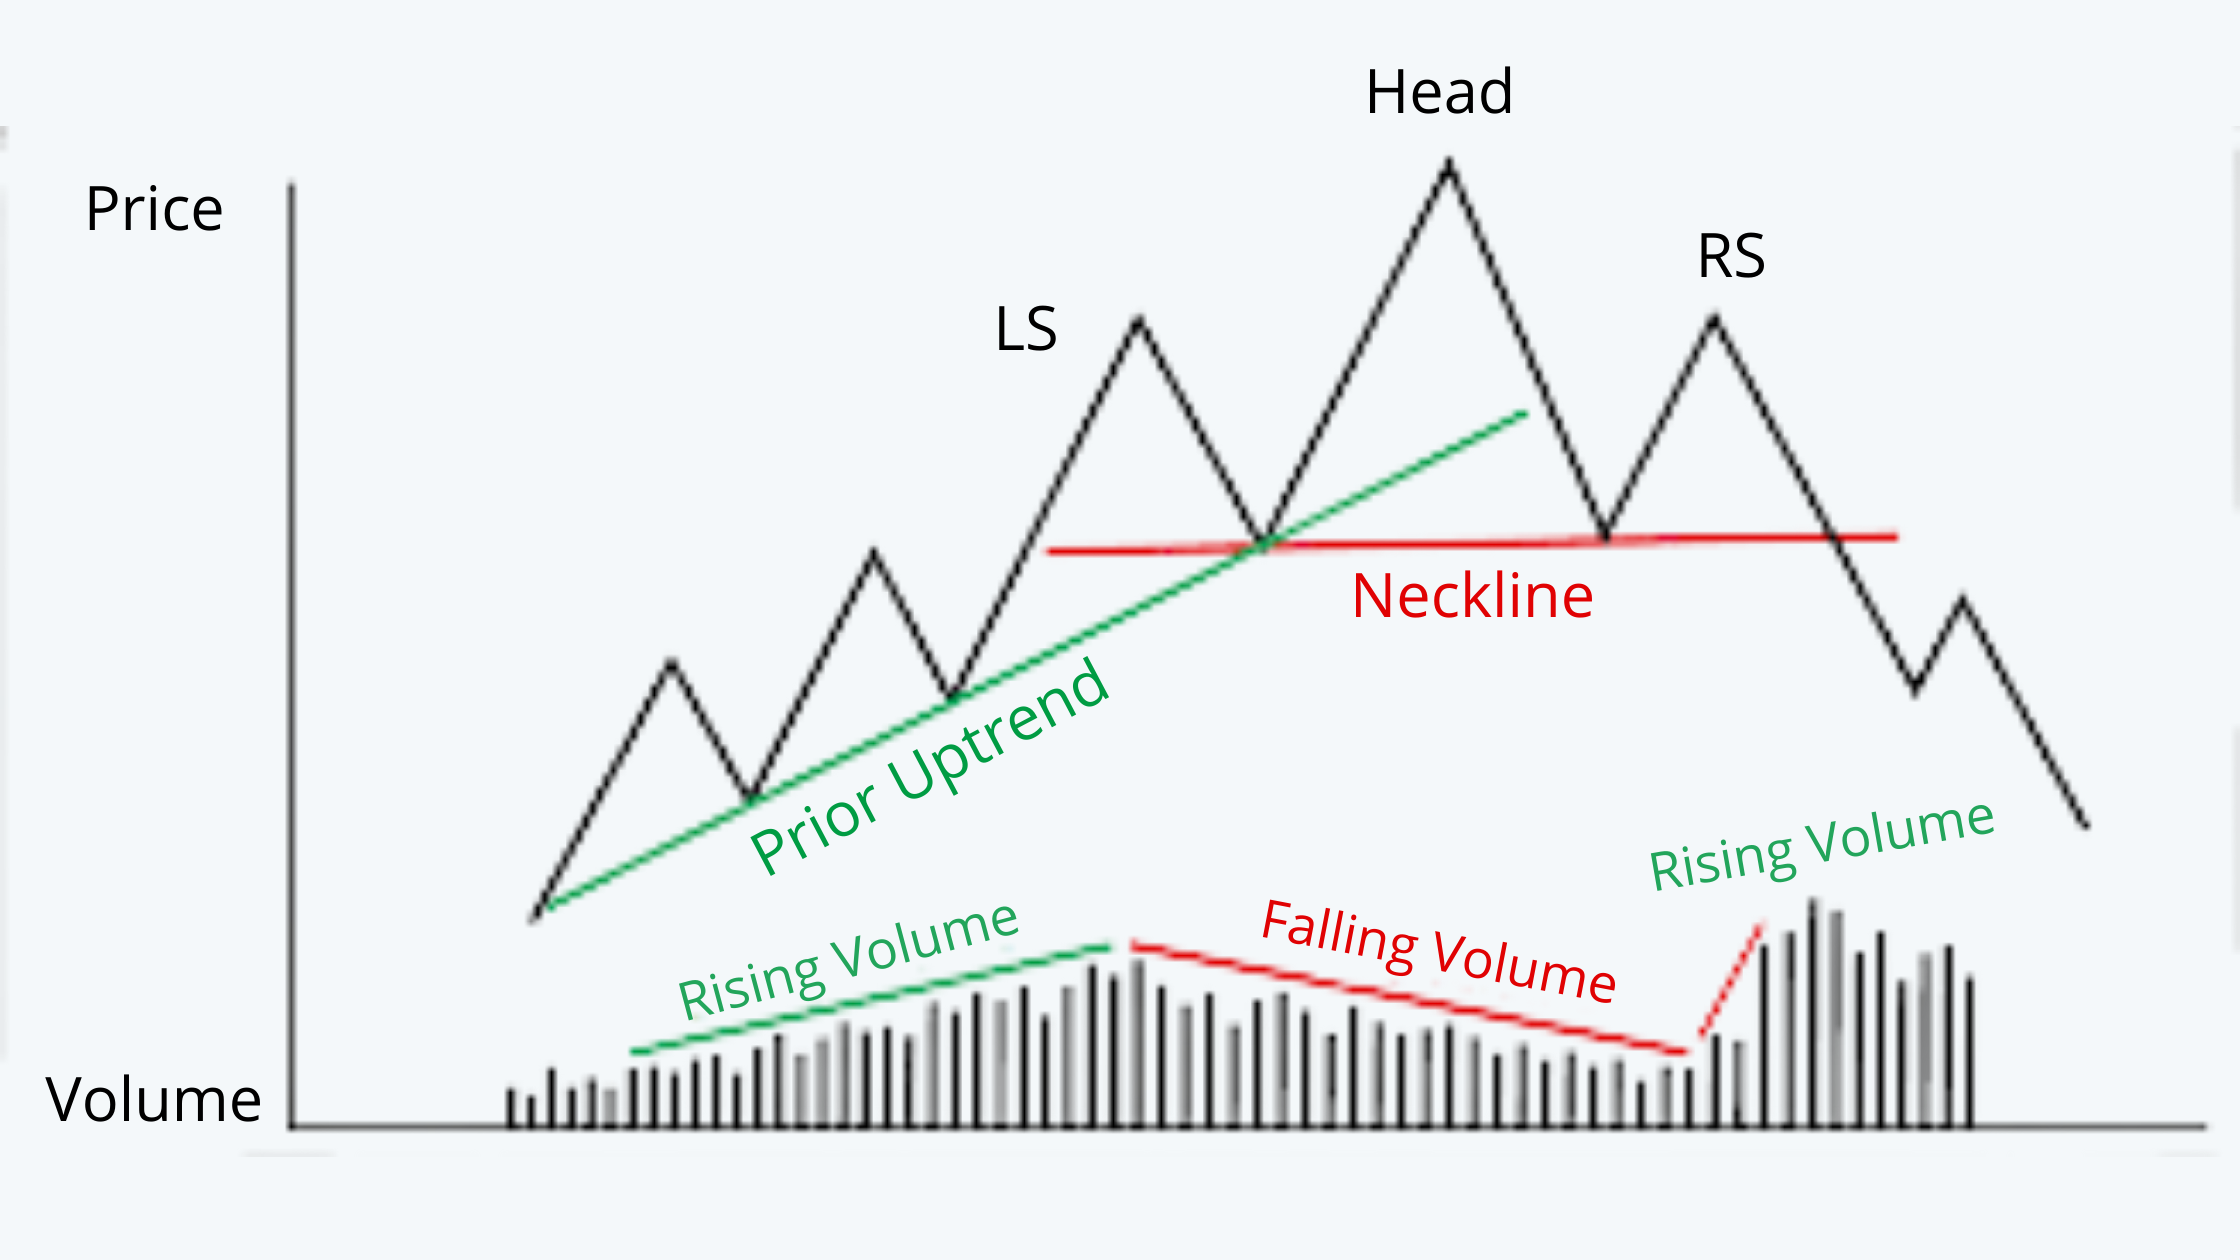
l. The neckline minus the distance between the head and the neckline is the price target for the analysts.
m. Sometimes, a head and shoulder pattern is seen, but the price line either fail to penetrate the neckline or rallies immediately after the penetration. Though this pattern is called head and shoulder, the failure rate is very rare; it is followed by a very strong rally.
It is therefore advisable to wait for a decisive breakout and see whether the volume characteristics confirm to the pattern.
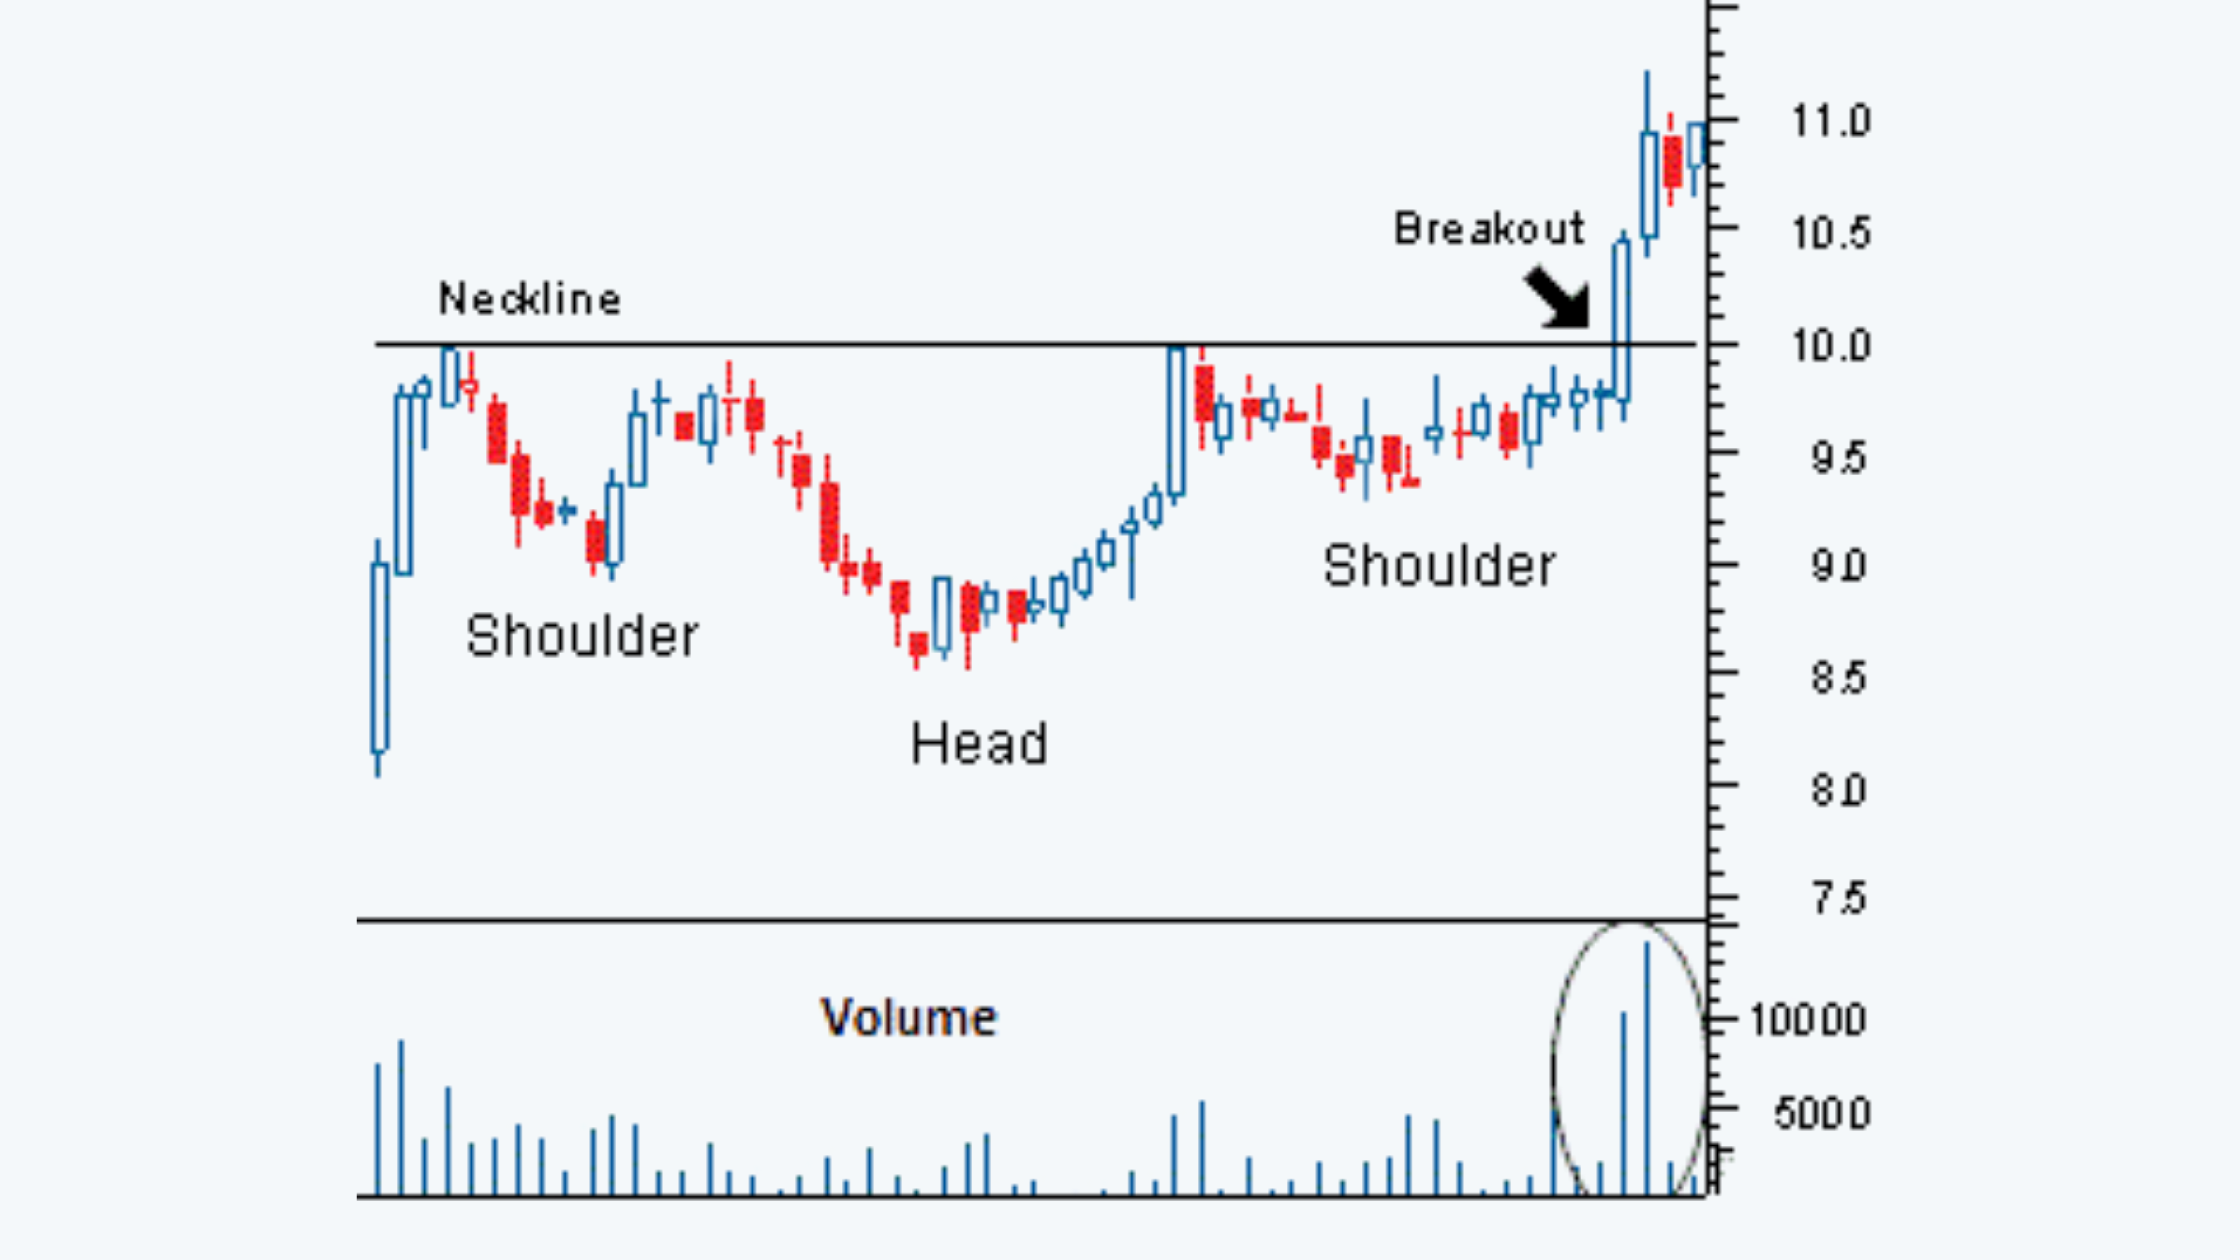
Inverse Head-and-Shoulder
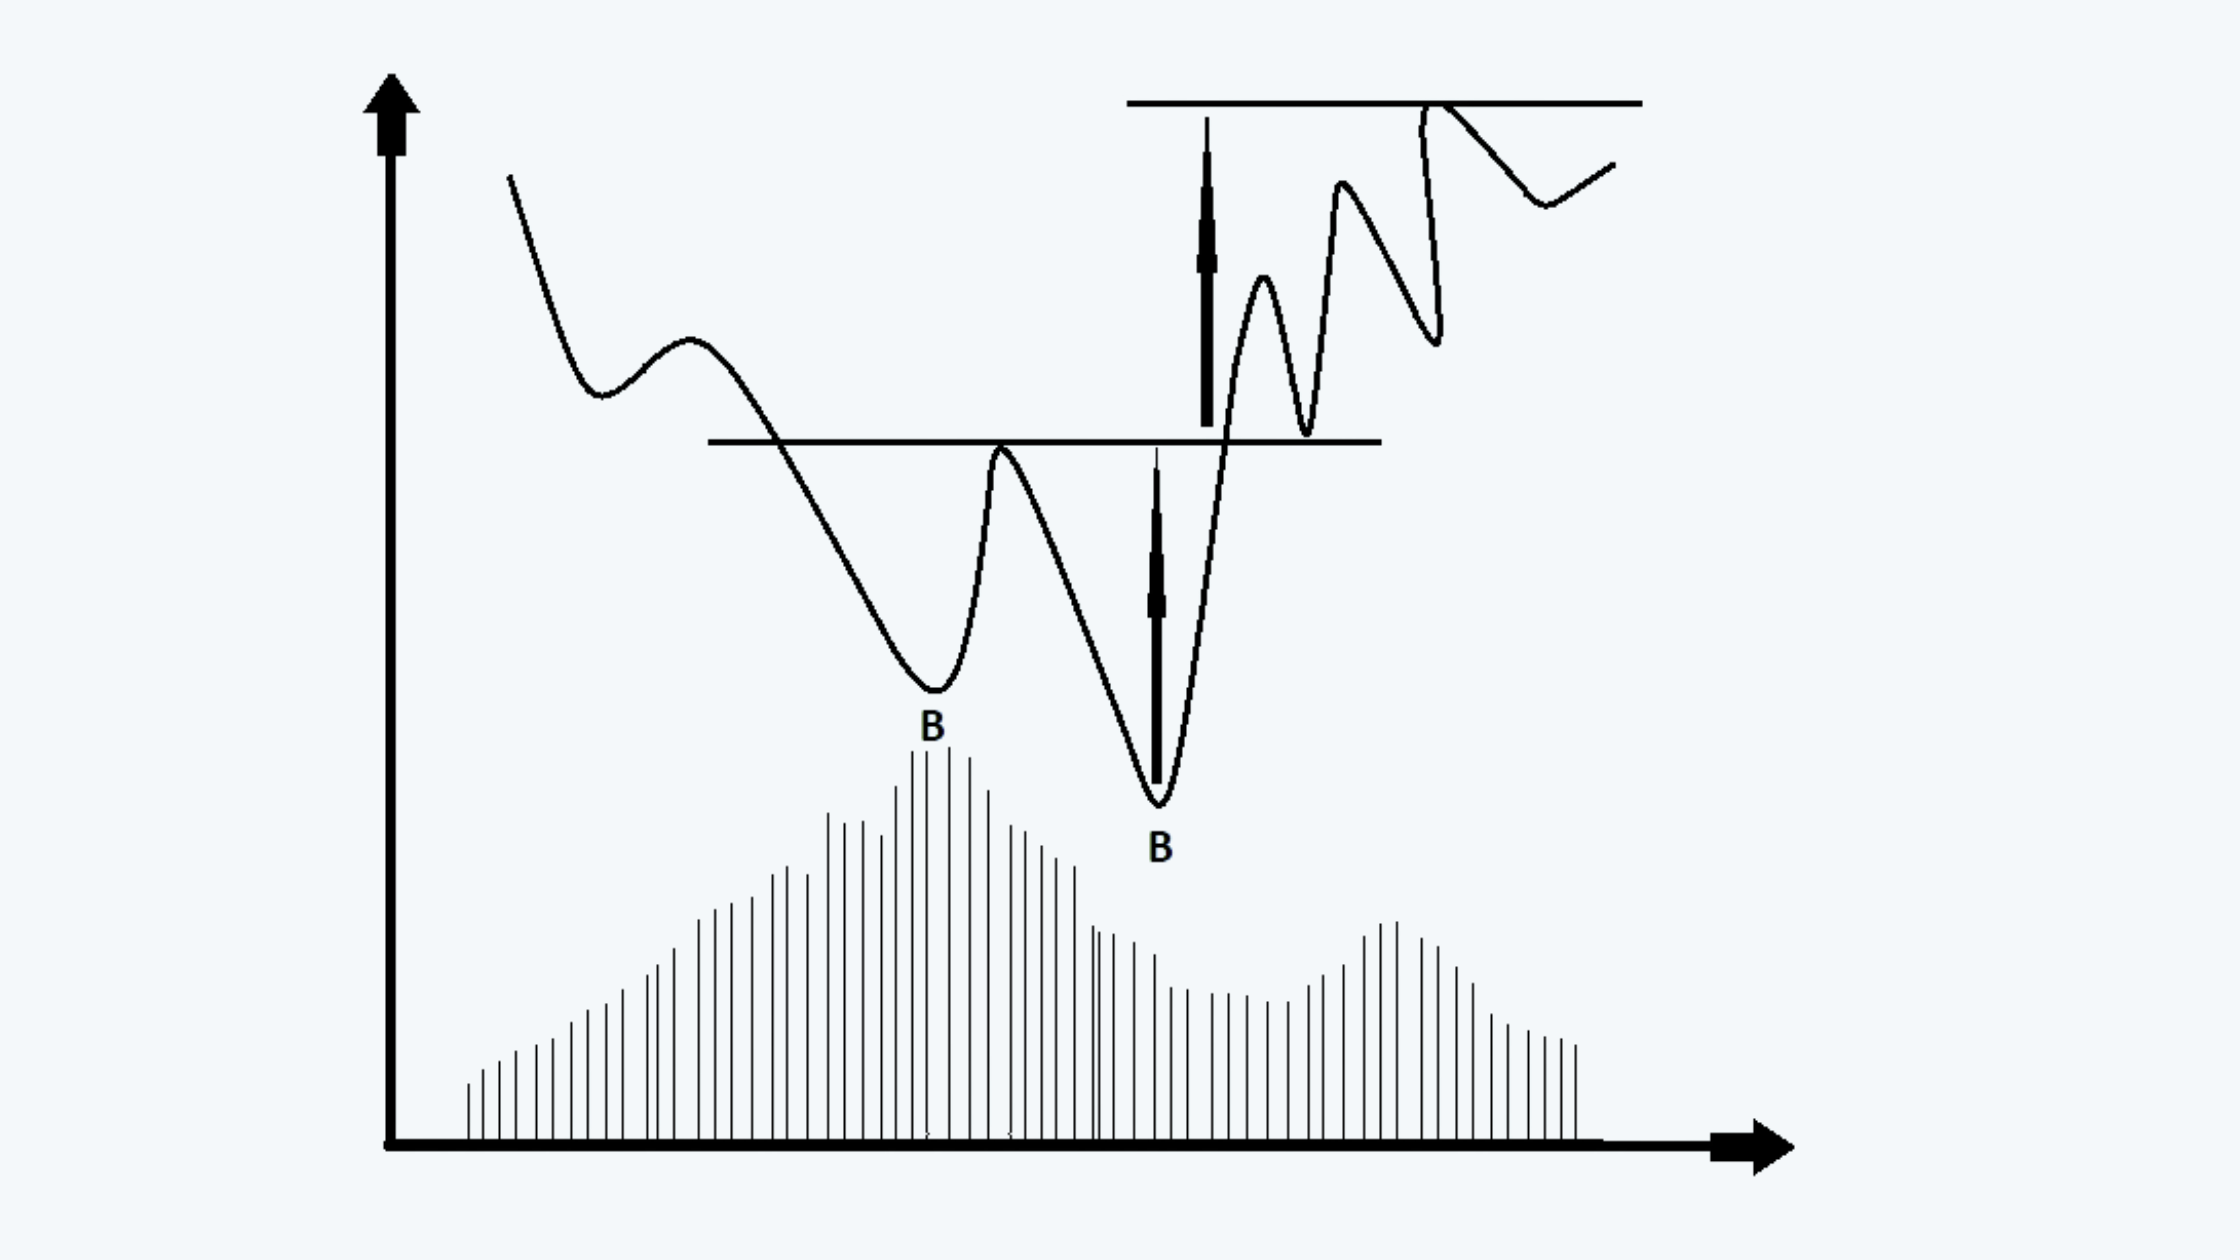
a. Head and shoulder pattern occurring at market bottoms indicates a reversal and is called the ‘inverted head and shoulder’.
b. Volume is high at the bottom of the left shoulder and significantly contracts during the formation of the right shoulder.
c. The bull market is heralded when the neckline is penetrated.
d. The following figure shows the inverse head and shoulder pattern along with the volume:
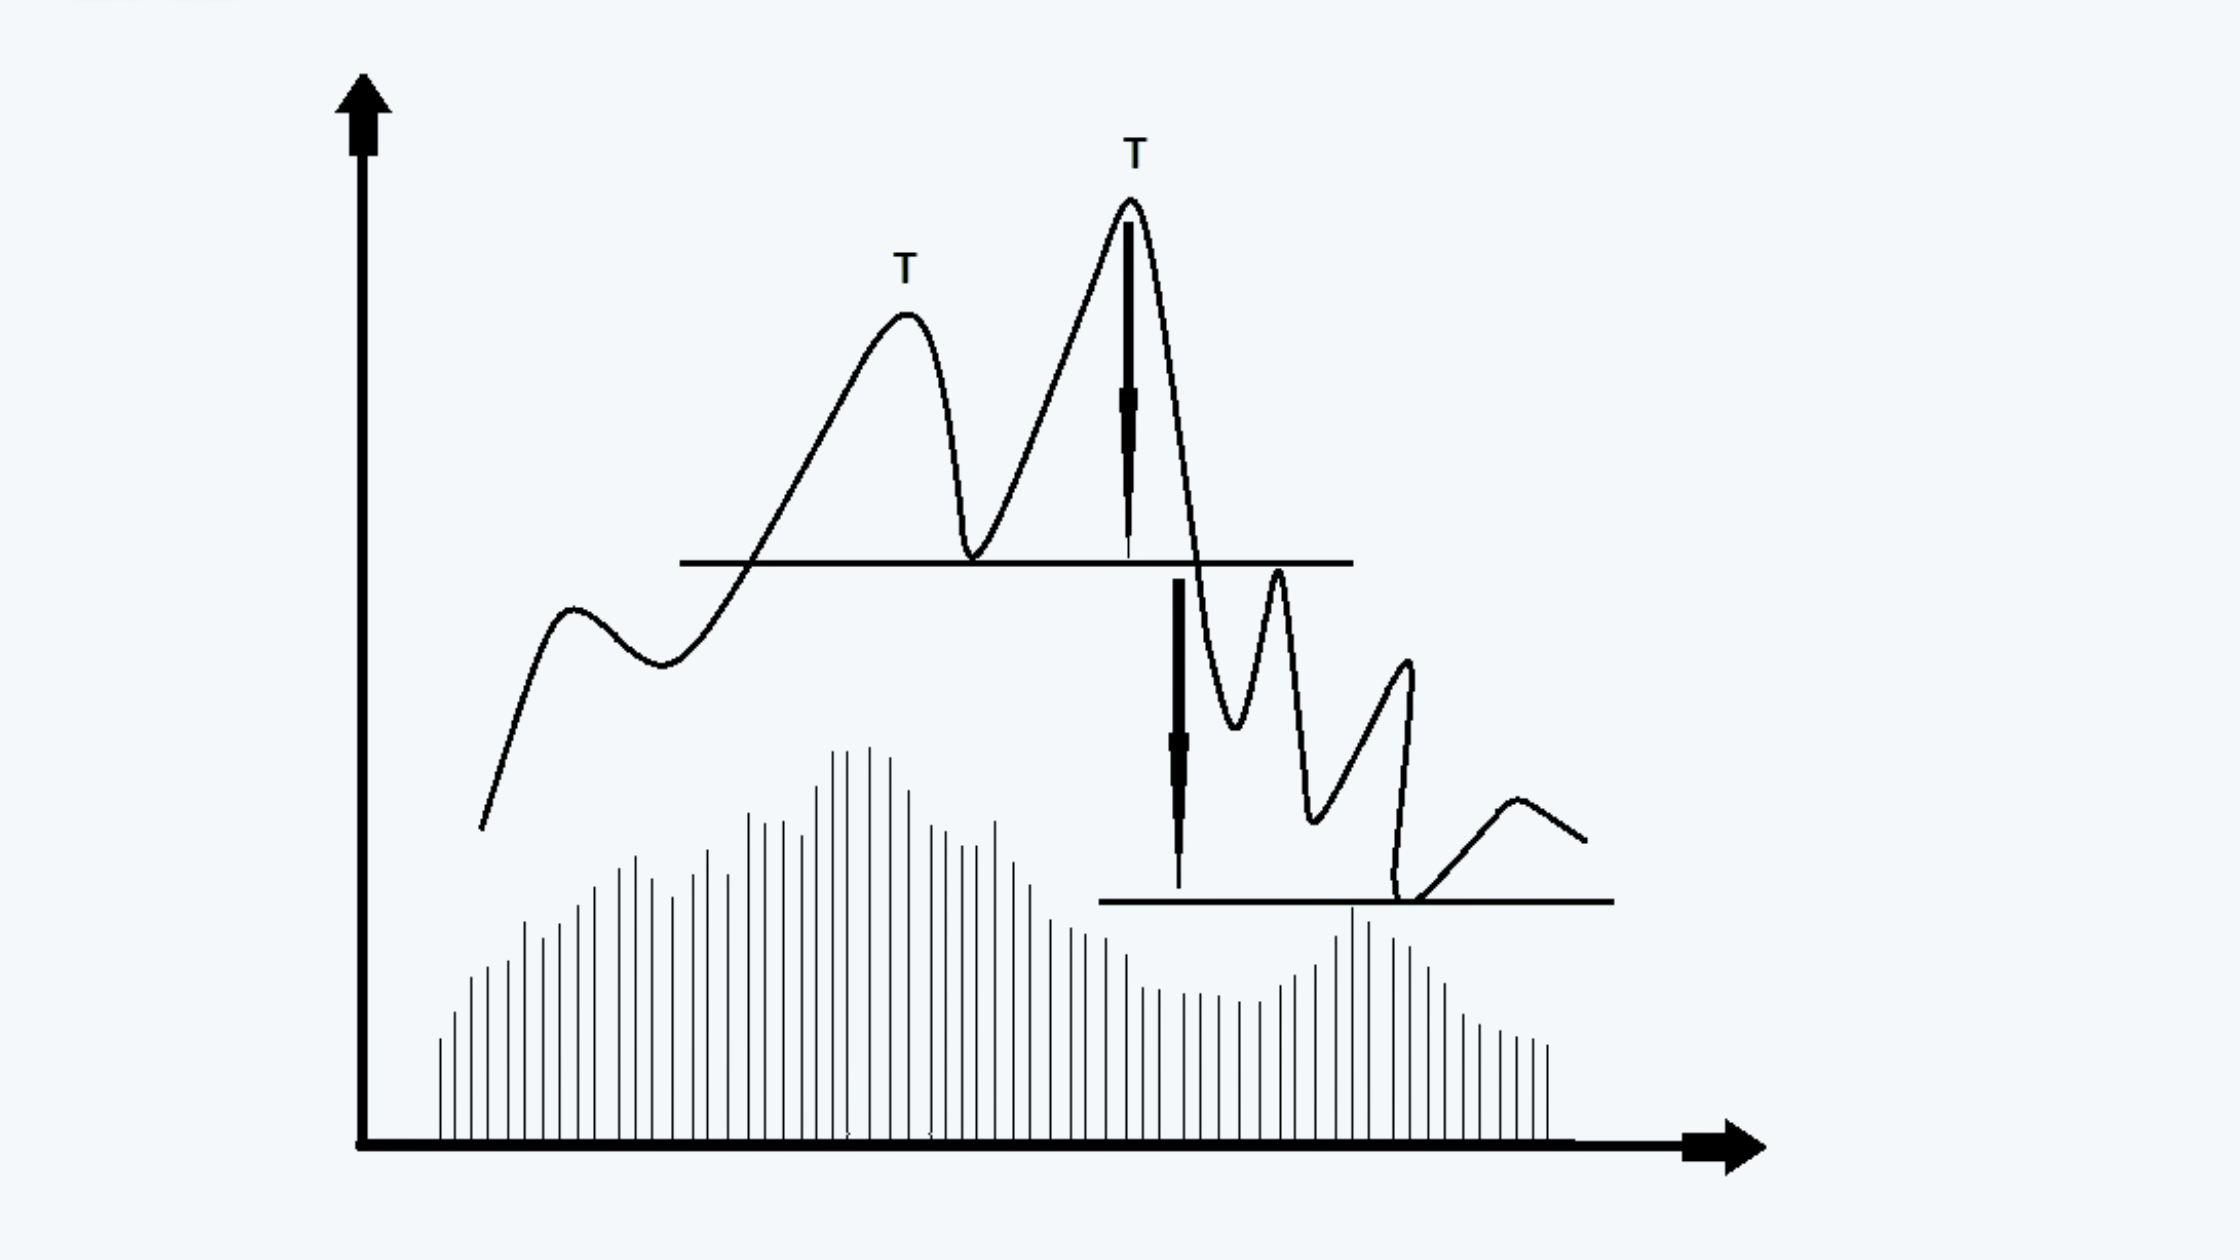
Double Tops and Bottom
a. When prices are found to react after rallying up to a certain level, technical analysts watch the rallies with caution. If the subsequent rallies also fail to rise above the previous high, a level of resistance is found to be developing. A classic pattern that indicates such a tendency is the “Double Top” formation.
b. A double top is formed when prices reach the previous high and react immediately, the two highs reach being almost at the same level. Two peaks are seen at comparable heights with a reaction forming the valley between them.
c. The prices break out into a bearish phase, once they penetrate the neckline drawn across the bottom of the intervening reaction. The measuring implication is similar for the head and shoulder formation.
d. If the price line falls from the neckline by a distance equal to the distance between the peak and the trough, the indication is to sell.
e. Volume is found to be distinctly low at the second top.
f. An example of the double top formation is:
g. A double bottom is just the reverse of double top and occurs at the end of a down trend in prices.
h. An example of the double bottom formation is:
i. While identifying double tops and bottoms, it should be remembered that the longer it takes for the second top (bottom) to appear, the deeper the intervening valley (peak) and the more reliable the reversal.
j. Sometimes, a minor rally can be seen in between the peaks (troughs) of a double tops (bottom) formation.
k. There is a general consensus that there are no triple tops/bottoms.
There are other reversal patterns such as the double bottom, triple bottom, etc.
Continuation Pattern
a. A continuation pattern shows a slight tendency for the trend to continue in the same direction after a continuation pattern as it did before.
b. Not all continuation patterns will result in a continuation of the trend. Many will result in reversals. By waiting for the breakout, traders can see which it will be.
c. The most common continuation patterns are triangles, and these can be further divided into ascending triangles, descending triangles, symmetrical triangles.
d. A triangle pattern is formed as the range between high and low prices on the asset’s timeline narrows.
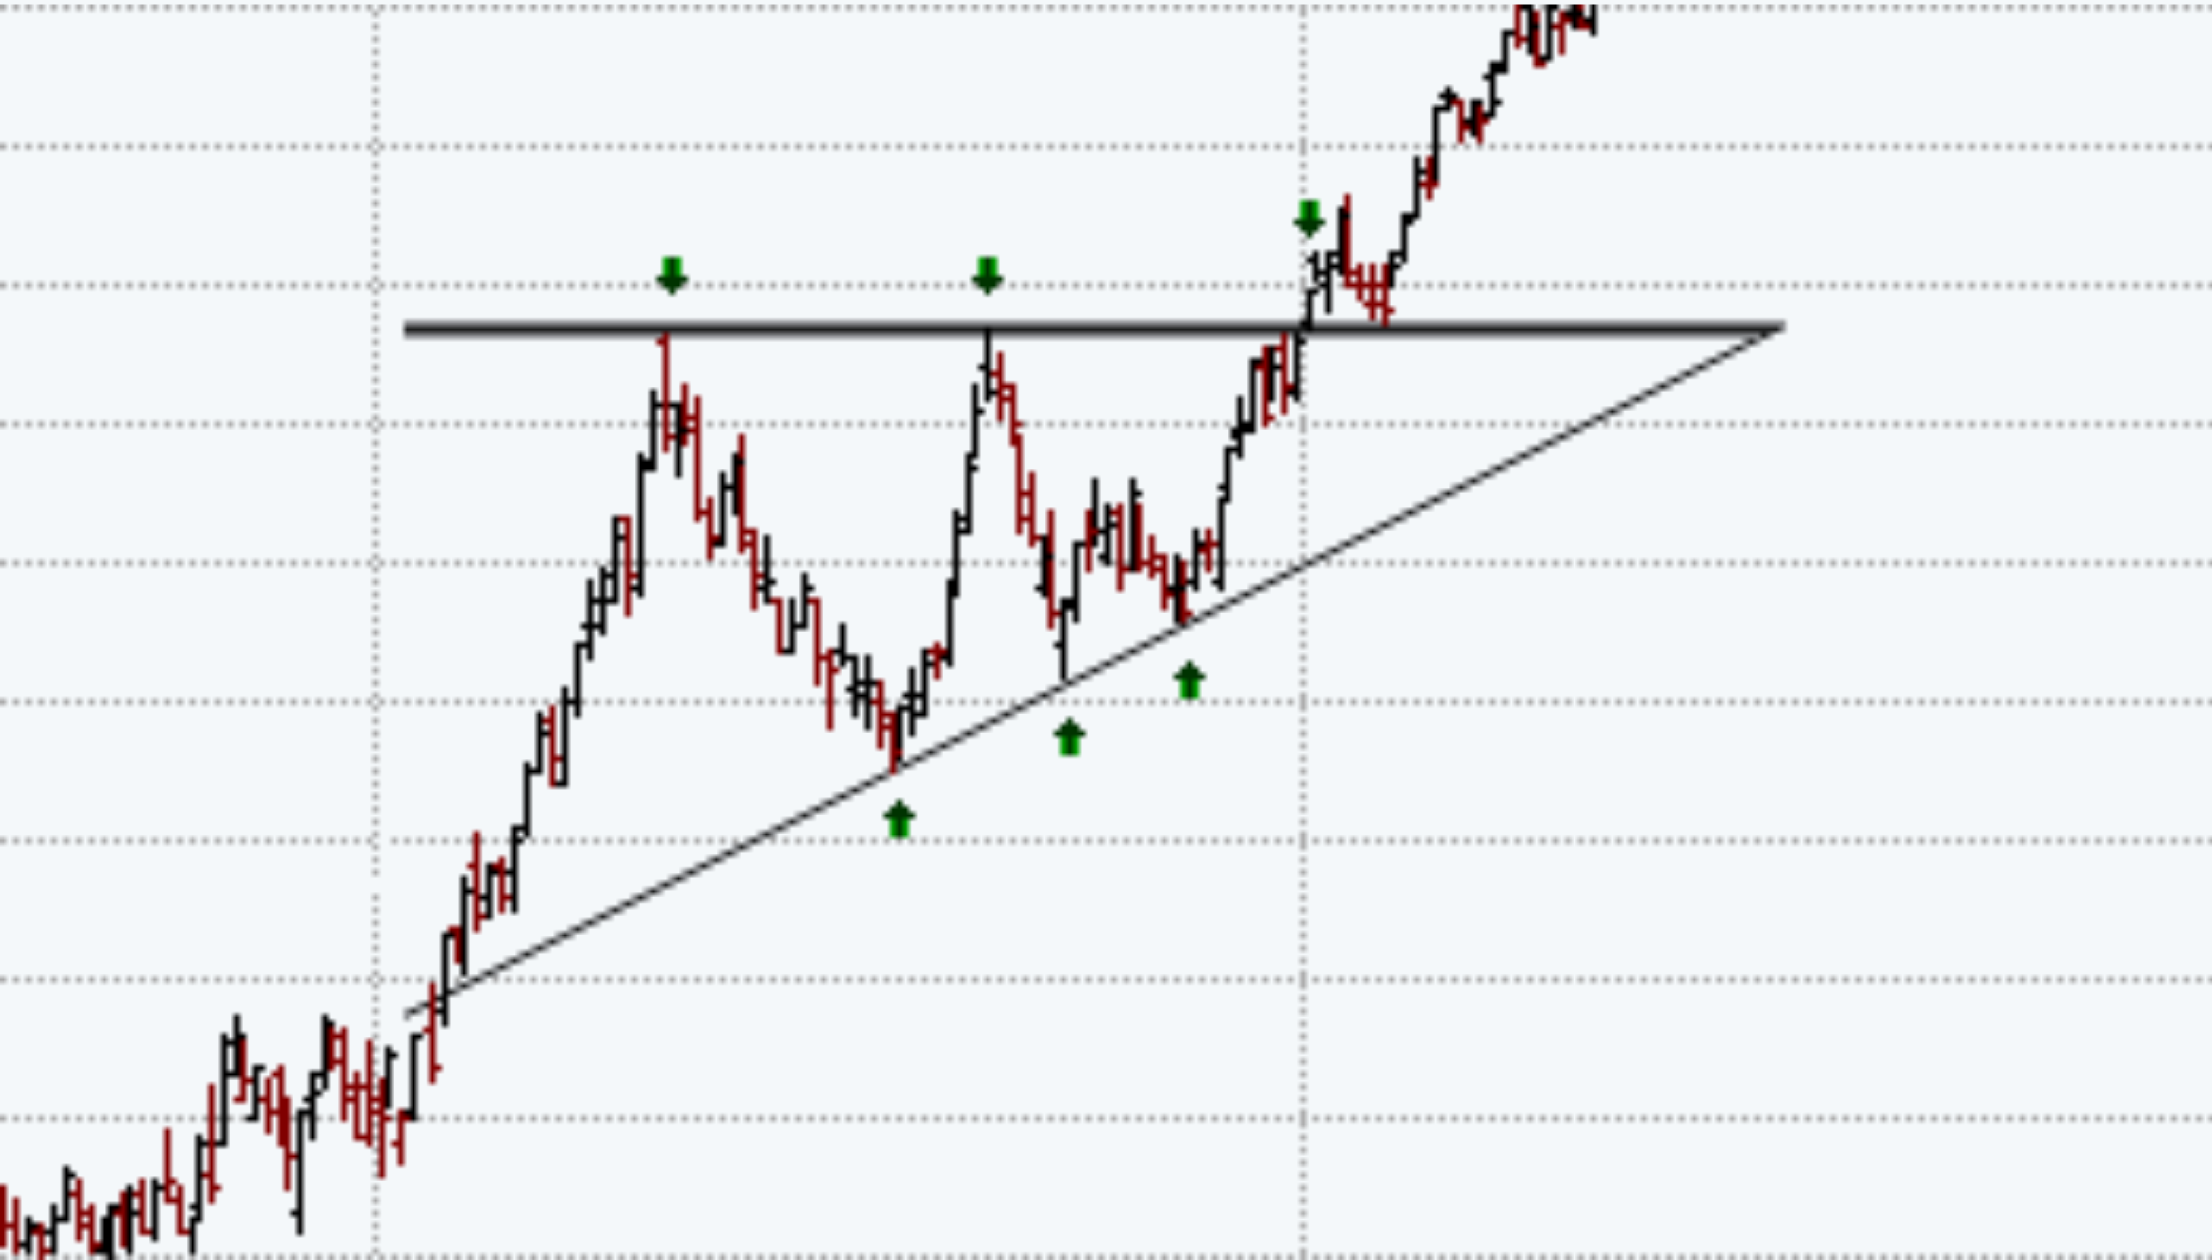
Ascending Triangle
a. An ascending triangle is formed by rising swing lows creating an ascending line when they are connected.
b. On an ascending triangle, two or more equal highs form a horizontal line representing overhead supply.
c. This line serves as a price ceiling, effectively preventing further movement of price.
d. Some troughs are also formed passing through the ascending timeline.
e. The price always falls below the upper ceiling, but the lows keep on getting higher making a bullish formation.
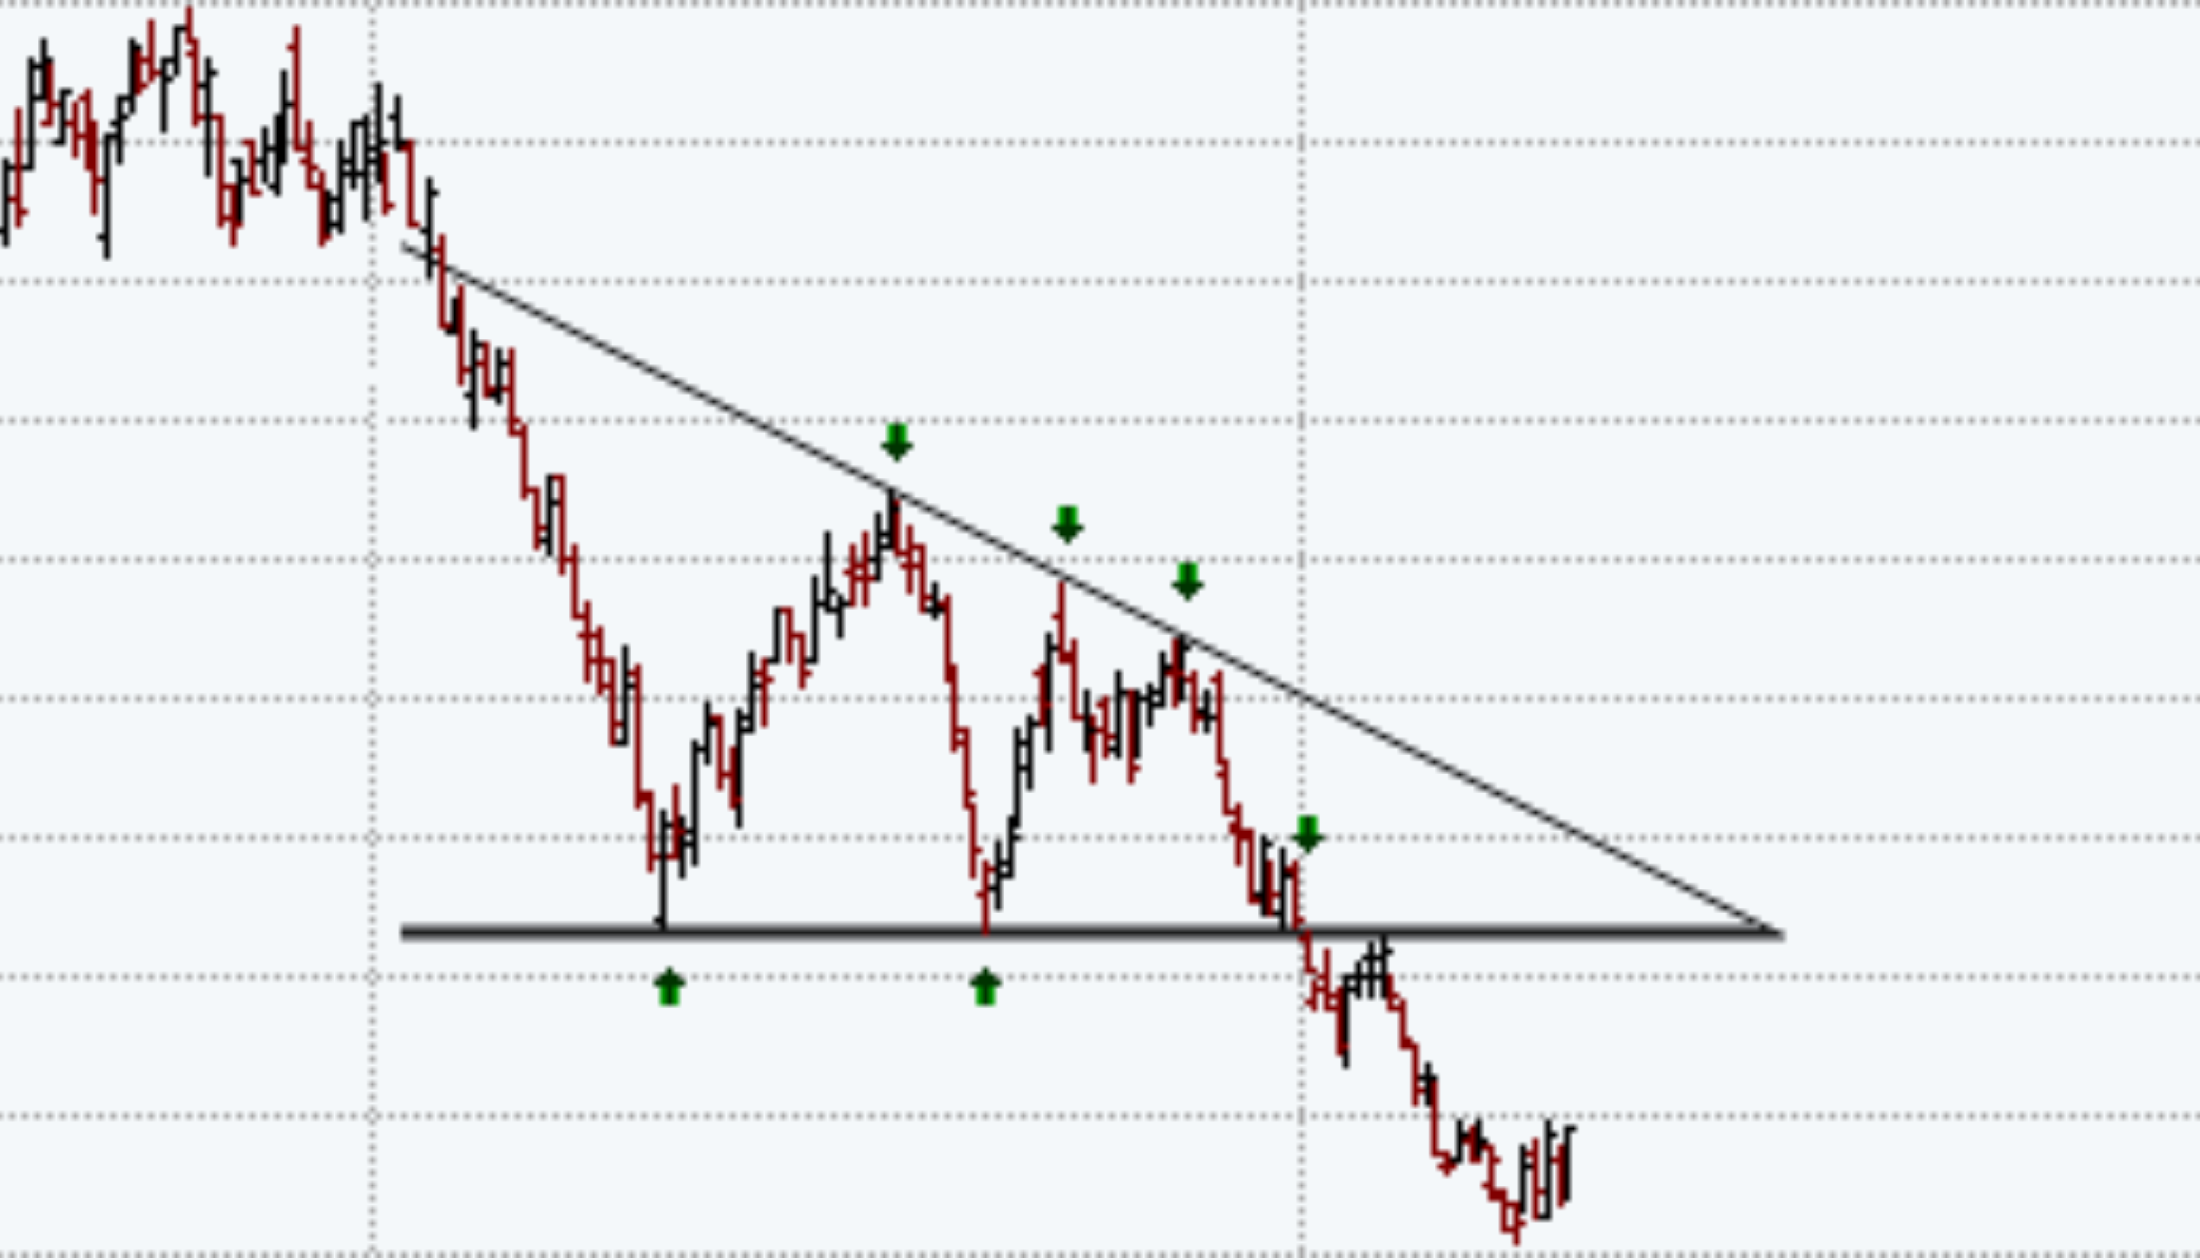
Descending Triangles
a. The swing highs are declining in a descending triangle, forming a downward sloping trendline when they are connected. The swing lows reach similar levels, forming a horizontal trendline when connected.
b. The descending triangles are formed during the downtrends.
c. The bottom line in a descending triangle is formed by two or more equal lows. This line usually acts as a price floor and prevents the price from further falling.
d. There is a declining line that converges the bottom line towards the right. It is formed by joining two or more declining highs or peaks.
e. This pattern is an indicator of higher selling pressure or bearish formation.
f. The following figure shows an example of descending triangle pattern:
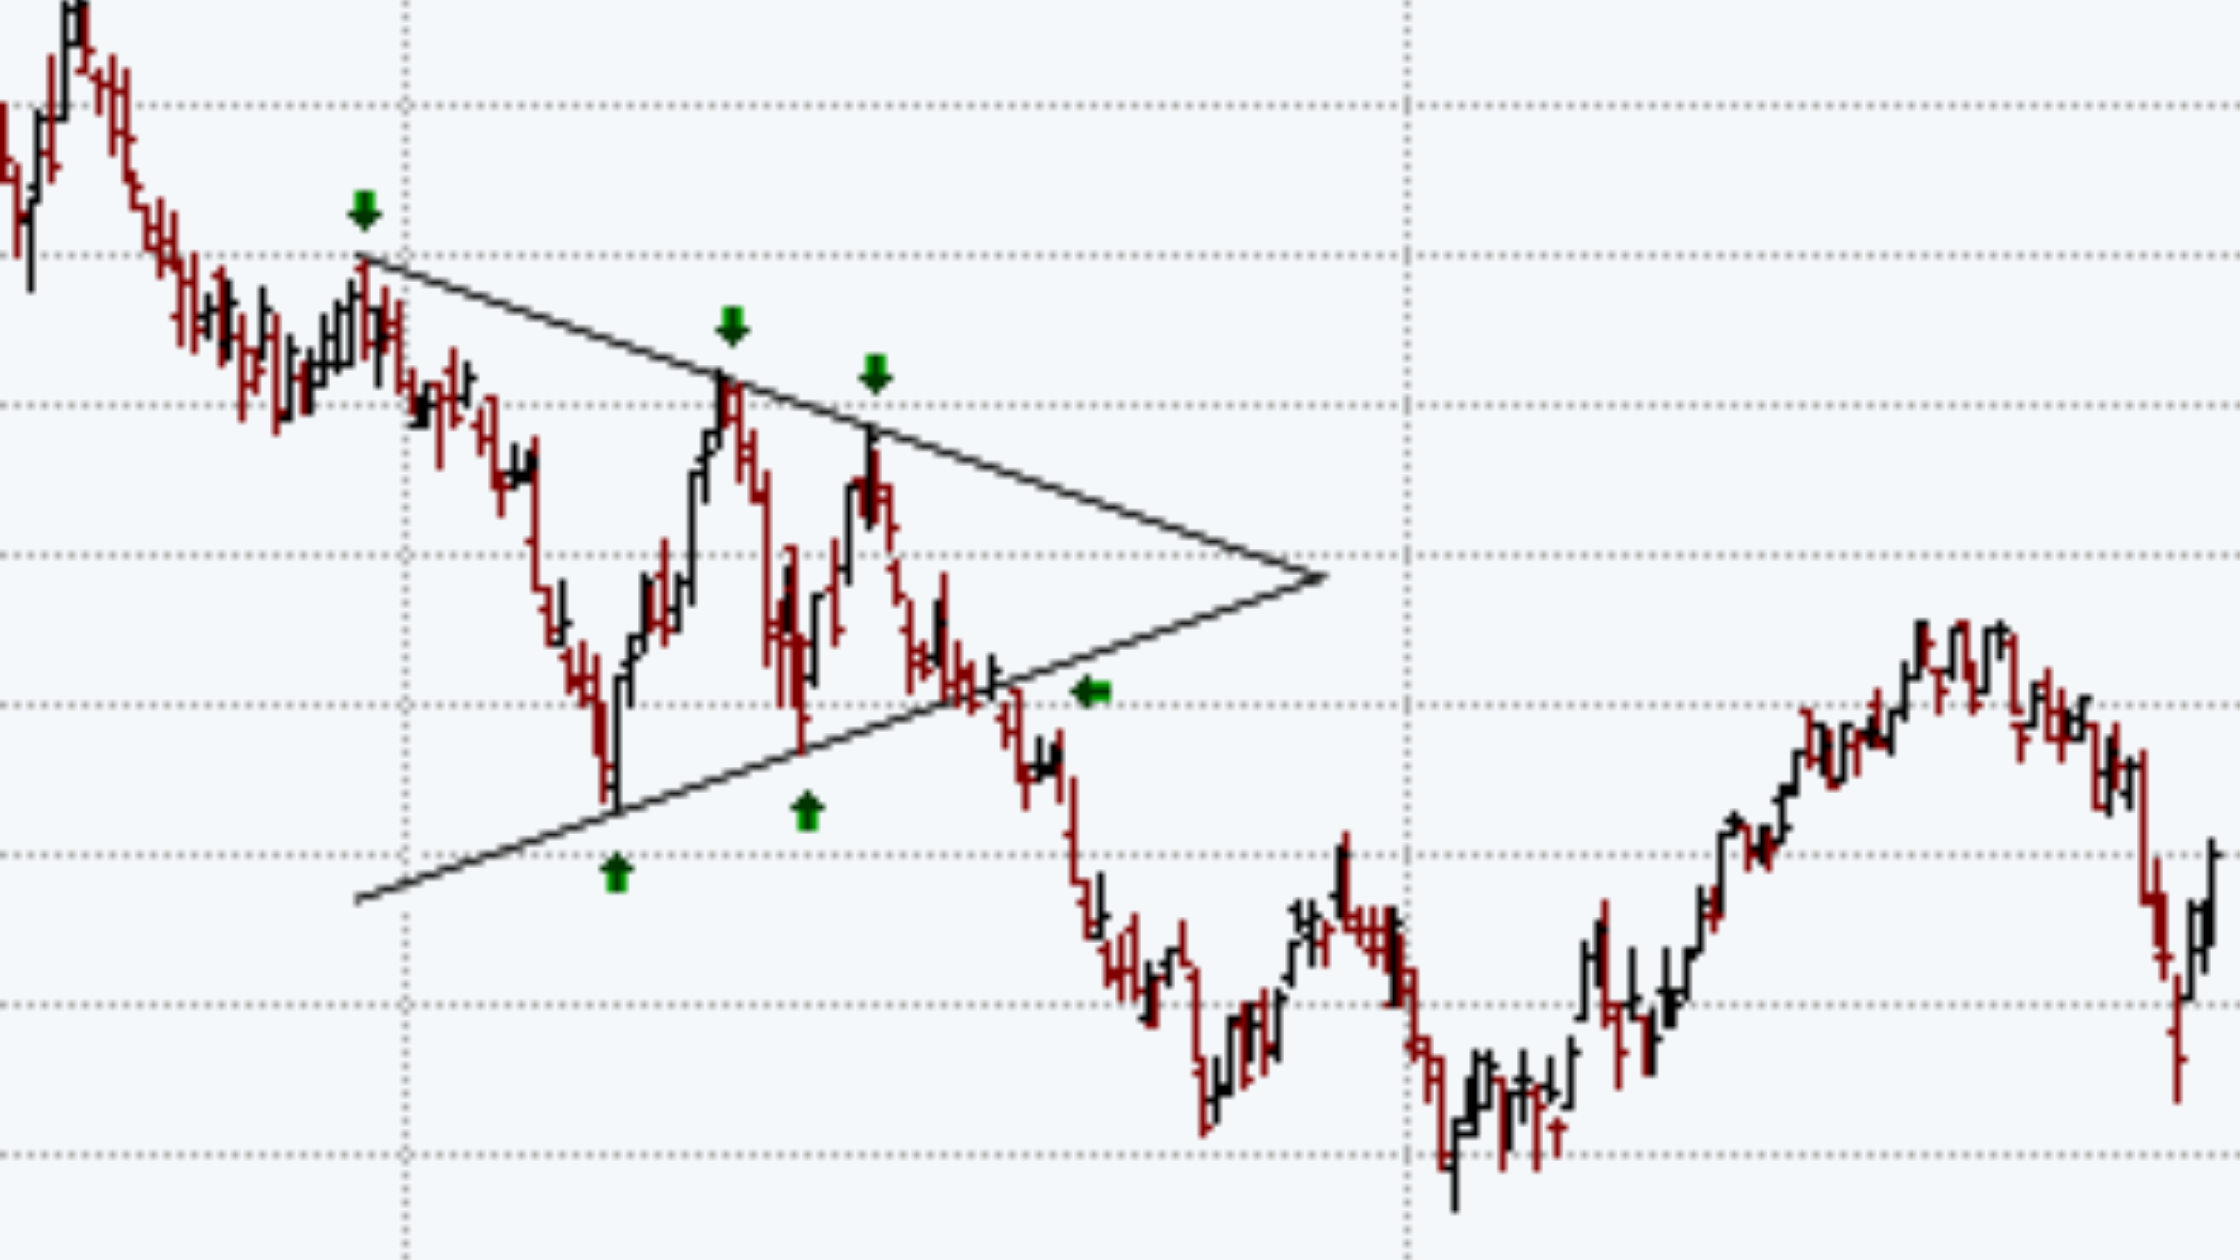
Symmetrical Triangle
a. A symmetrical triangle has descending swing highs and ascending swing lows. This creates a descending and rising trendline that converges toward each other.
b. It is formed during a trend containing two or higher lows and lower highs. When we connect these points we get the convergence forming a triangle-like pattern.
Rectangles
a. A rectangle is an important consolidation pattern, which can be formed either during the uptrend or in the course of the downtrend in prices.
b. A series of minor rallies and reactions which have almost identical peaks and troughs signal the formation of the rectangle. (Note that the rectangles are formations indicated as ‘Lines’ in the Dow Theory.
c. A rectangle indicates equal pressure being exercised by buyers and sellers, and the combat is indecisive until a breakout occurs. A price line may breakout on either side. A rectangle, therefore, may be a consolidation pattern or result in reversal.
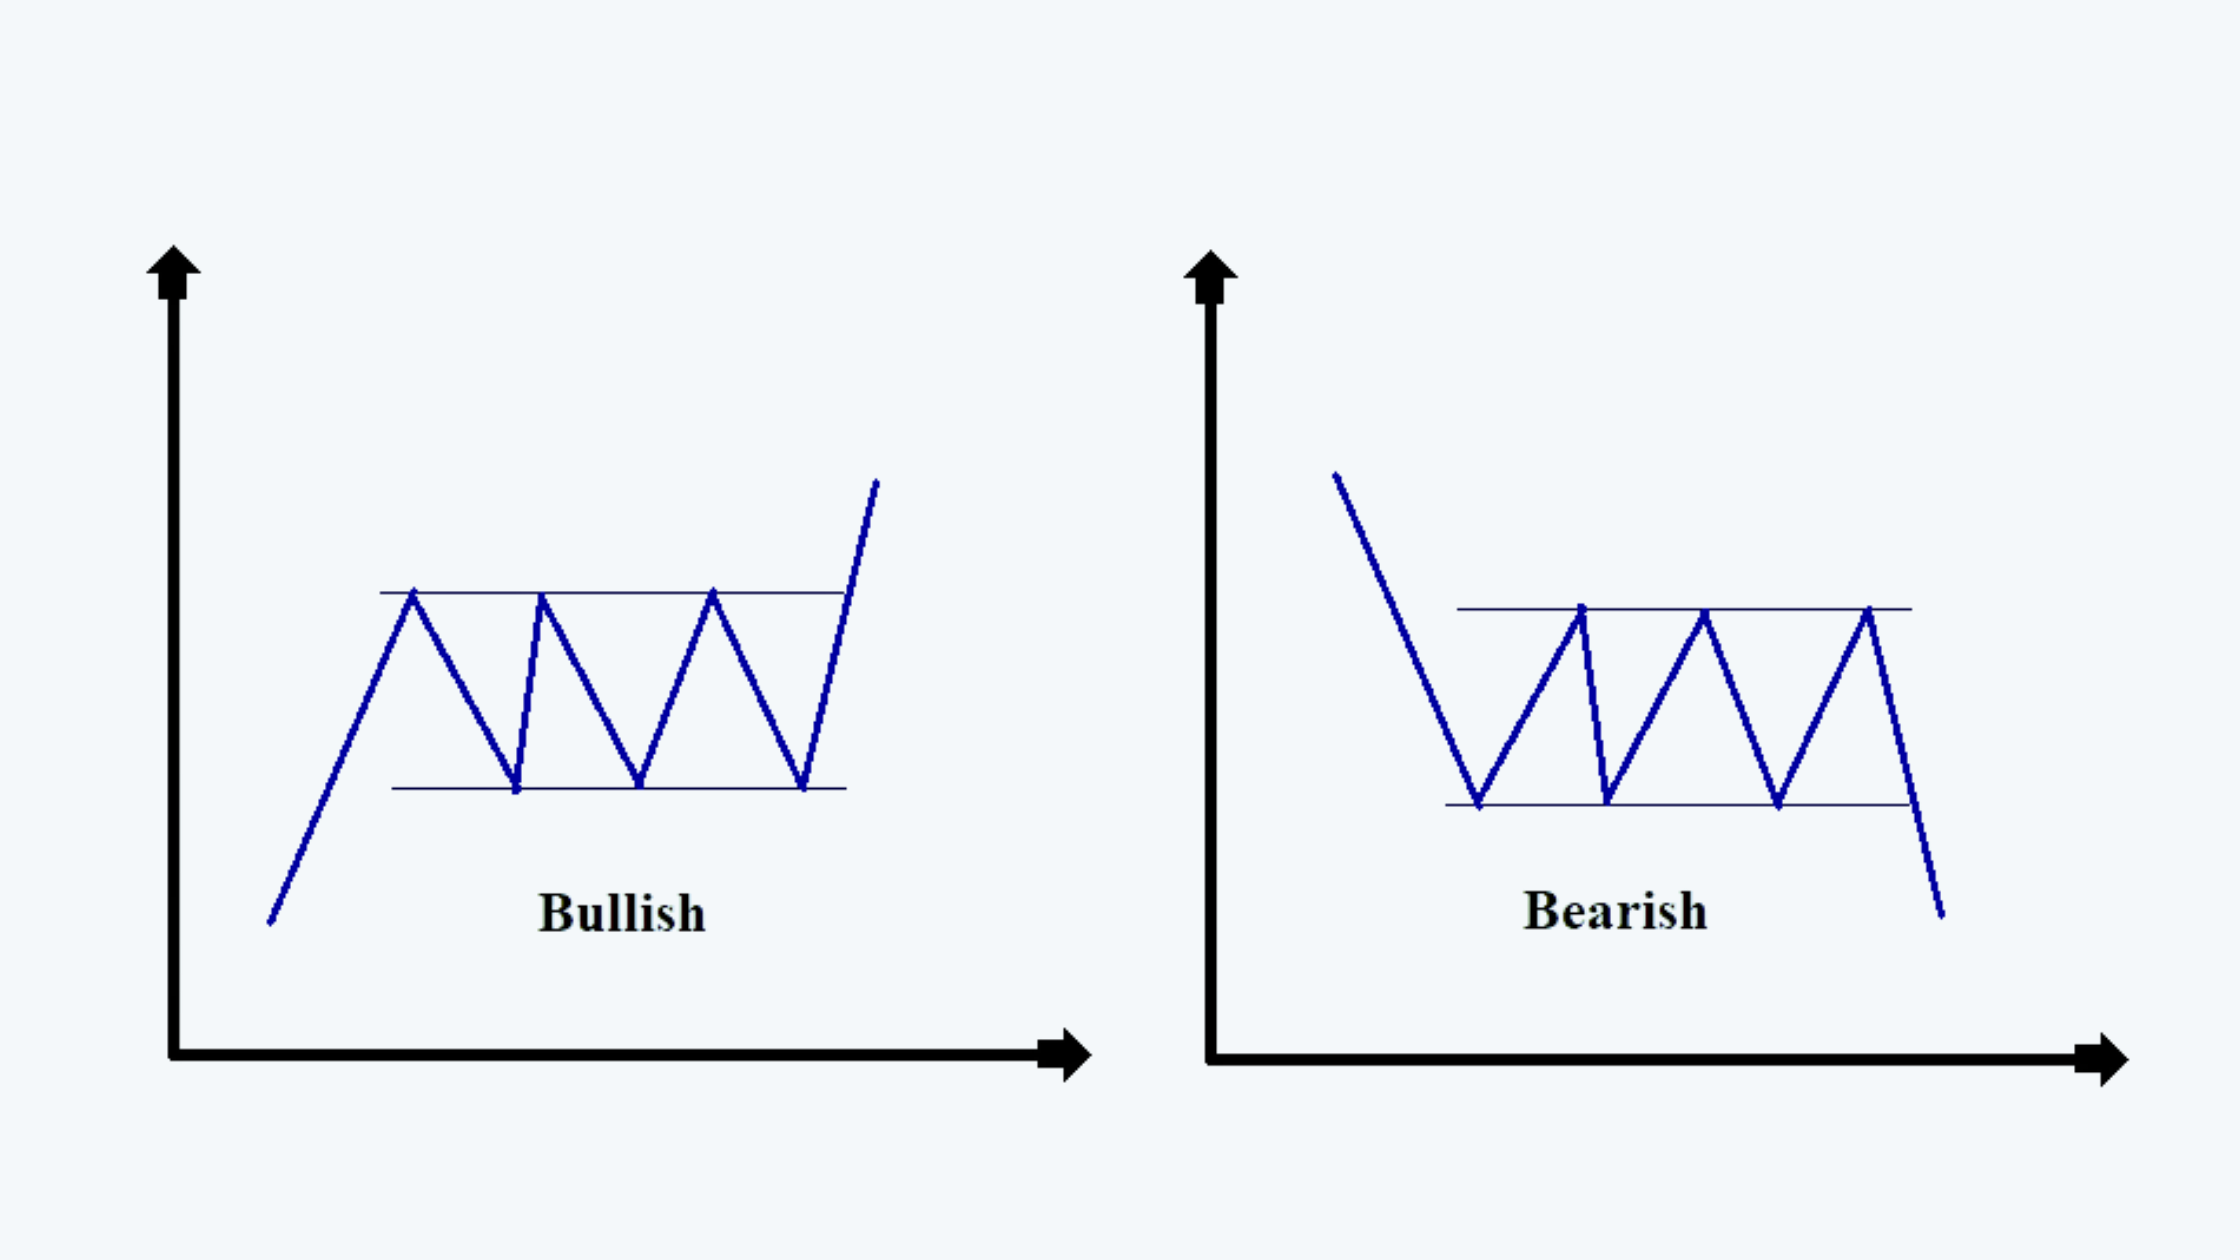
d. The rectangles have both the resistance and support lines which are parallel to each other, instead of them forming an angle.
e. If the rectangle patterns are observed in the short term, they are called flags.
There are other continuation patterns such as flags, pennants, etc.