Course Content
PORTFOLIO MANAGEMENT: AN OVERVIEW
This topic is covered in study session 18 of the material provided by the Institute. After reading this chapter, a student shall be able to: a. describe the portfolio approach to investing; b. describe the steps in the portfolio management process; c. describe types of investors and distinctive characteristics and needs of each; d. describe defined contribution and defined benefit pension plans; e. describe aspects of the asset management industry; f. describe mutual funds and compare them with other pooled investment products.
0/6
PORTFOLIO RISK AND RETURN: PART I
This topic is covered in study session 18 of the material provided by the institute. After reading this chapter, a student shall be able to: a. calculate and interpret major return measures and describe their appropriate uses; b. compare the money-weighted and time-weighted rates of return and evaluate the performance of portfolios based on these measures; c. describe characteristics of the major asset classes that investors consider in forming portfolios; d. calculate and interpret the mean, variance, and covariance (or correlation) of asset returns based on historical data; e. explain risk aversion and its implications for portfolio selection; f. calculate and interpret portfolio standard deviation; g. describe the effect on a portfolio’s risk of investing in assets that are less than perfectly correlated; h. describe and interpret the minimum-variance and efficient frontiers of risky assets and the global minimum-variance portfolio; i. explain the selection of an optimal portfolio, given an investor’s utility (or risk aversion) and the capital allocation line.
0/6
PORTFOLIO RISK AND RETURN: PART II
This topic is covered in study session 18 of the material provided by the institute. After reading this chapter, a student shall be able to: a. describe the implications of combining a risk-free asset with a portfolio of risky assets; b. explain the capital allocation line (CAL) and the capital market line (CML); c. explain systematic and nonsystematic risk, including why an investor should not expect to receive an additional return for bearing nonsystematic risk; d. explain return-generating models (including the market model) and their uses; e. calculate and interpret beta; f. explain the capital asset pricing model (CAPM), including its assumptions, and the security market line (SML); g. calculate and interpret the expected return of an asset using the CAPM; h. describe and demonstrate applications of the CAPM and the SML. i. calculate and interpret the Sharpe ratio, Treynor ratio, M2, and Jensen’s alpha.
0/7
BASICS OF PORTFOLIO PLANNING AND CONSTRUCTION
This topic is covered in study session 19 of the material provided by the institute. After reading this chapter, a student shall be able to: a. describe the reasons for a written investment policy statement (IPS); b. describe the major components of an IPS; c. describe risk and return objectives and how they may be developed for a client; d. distinguish between the willingness and the ability (capacity) to take risk in analyzing an investor’s financial risk tolerance; e. describe the investment constraints of liquidity, time horizon, tax concerns, legal and regulatory factors, and unique circumstances and their implications for the choice of portfolio assets; f. explain the specification of asset classes in relation to asset allocation; g. describe the principles of portfolio construction and the role of asset allocation in relation to the IPS. h. describe how environmental, social, and governance (ESG) considerations may be integrated into portfolio planning and construction.
0/5
INTRODUCTION TO RISK MANAGEMENT
This topic is covered in study session 19 of the material provided by the institute. After reading this chapter, a student shall be able to: a. define risk management; b. describe features of a risk management framework; c. define risk governance and describe elements of effective risk governance; d. explain how risk tolerance affects risk management; e. describe risk budgeting and its role in risk governance; f. identify financial and non-financial sources of risk and describe how they may interact; g. describe methods for measuring and modifying risk exposures and factors to consider in choosing among the methods.
0/7
TECHNICAL ANALYSIS
This topic is covered in study session 19 of the material provided by the institute. After reading this chapter, a student shall be able to: a. explain principles of technical analysis, its applications, and its underlying assumptions; b. describe the construction of different types of technical analysis charts and interpret them; c. explain uses of trend, support, resistance lines, and change in polarity; d. describe common chart patterns; e. describe common technical analysis indicators (price-based, momentum oscillators, sentiment, and flow of funds); f. explain how technical analysts use cycles; g. describe the key tenets of Elliott Wave Theory and the importance of Fibonacci numbers; h. describe intermarket analysis as it relates to technical analysis and asset allocation.
0/7
Portfolio Management
About Lesson

LOS E requires us to:

calculate and interpret beta


Before we get to explain and calculate beta, we first need to understand what a Security Market Line or SML is.

Security Market Line

The security market line or the market line is another way to a perceived risk-return equilibrium relationship. With expected return on X-Axis and β on Y-axis, if the market portfolio is drawn and the line is extended to the risk-free rate of return, SML is obtained.

SML Portfolio Management CFA level 1 Study Notes

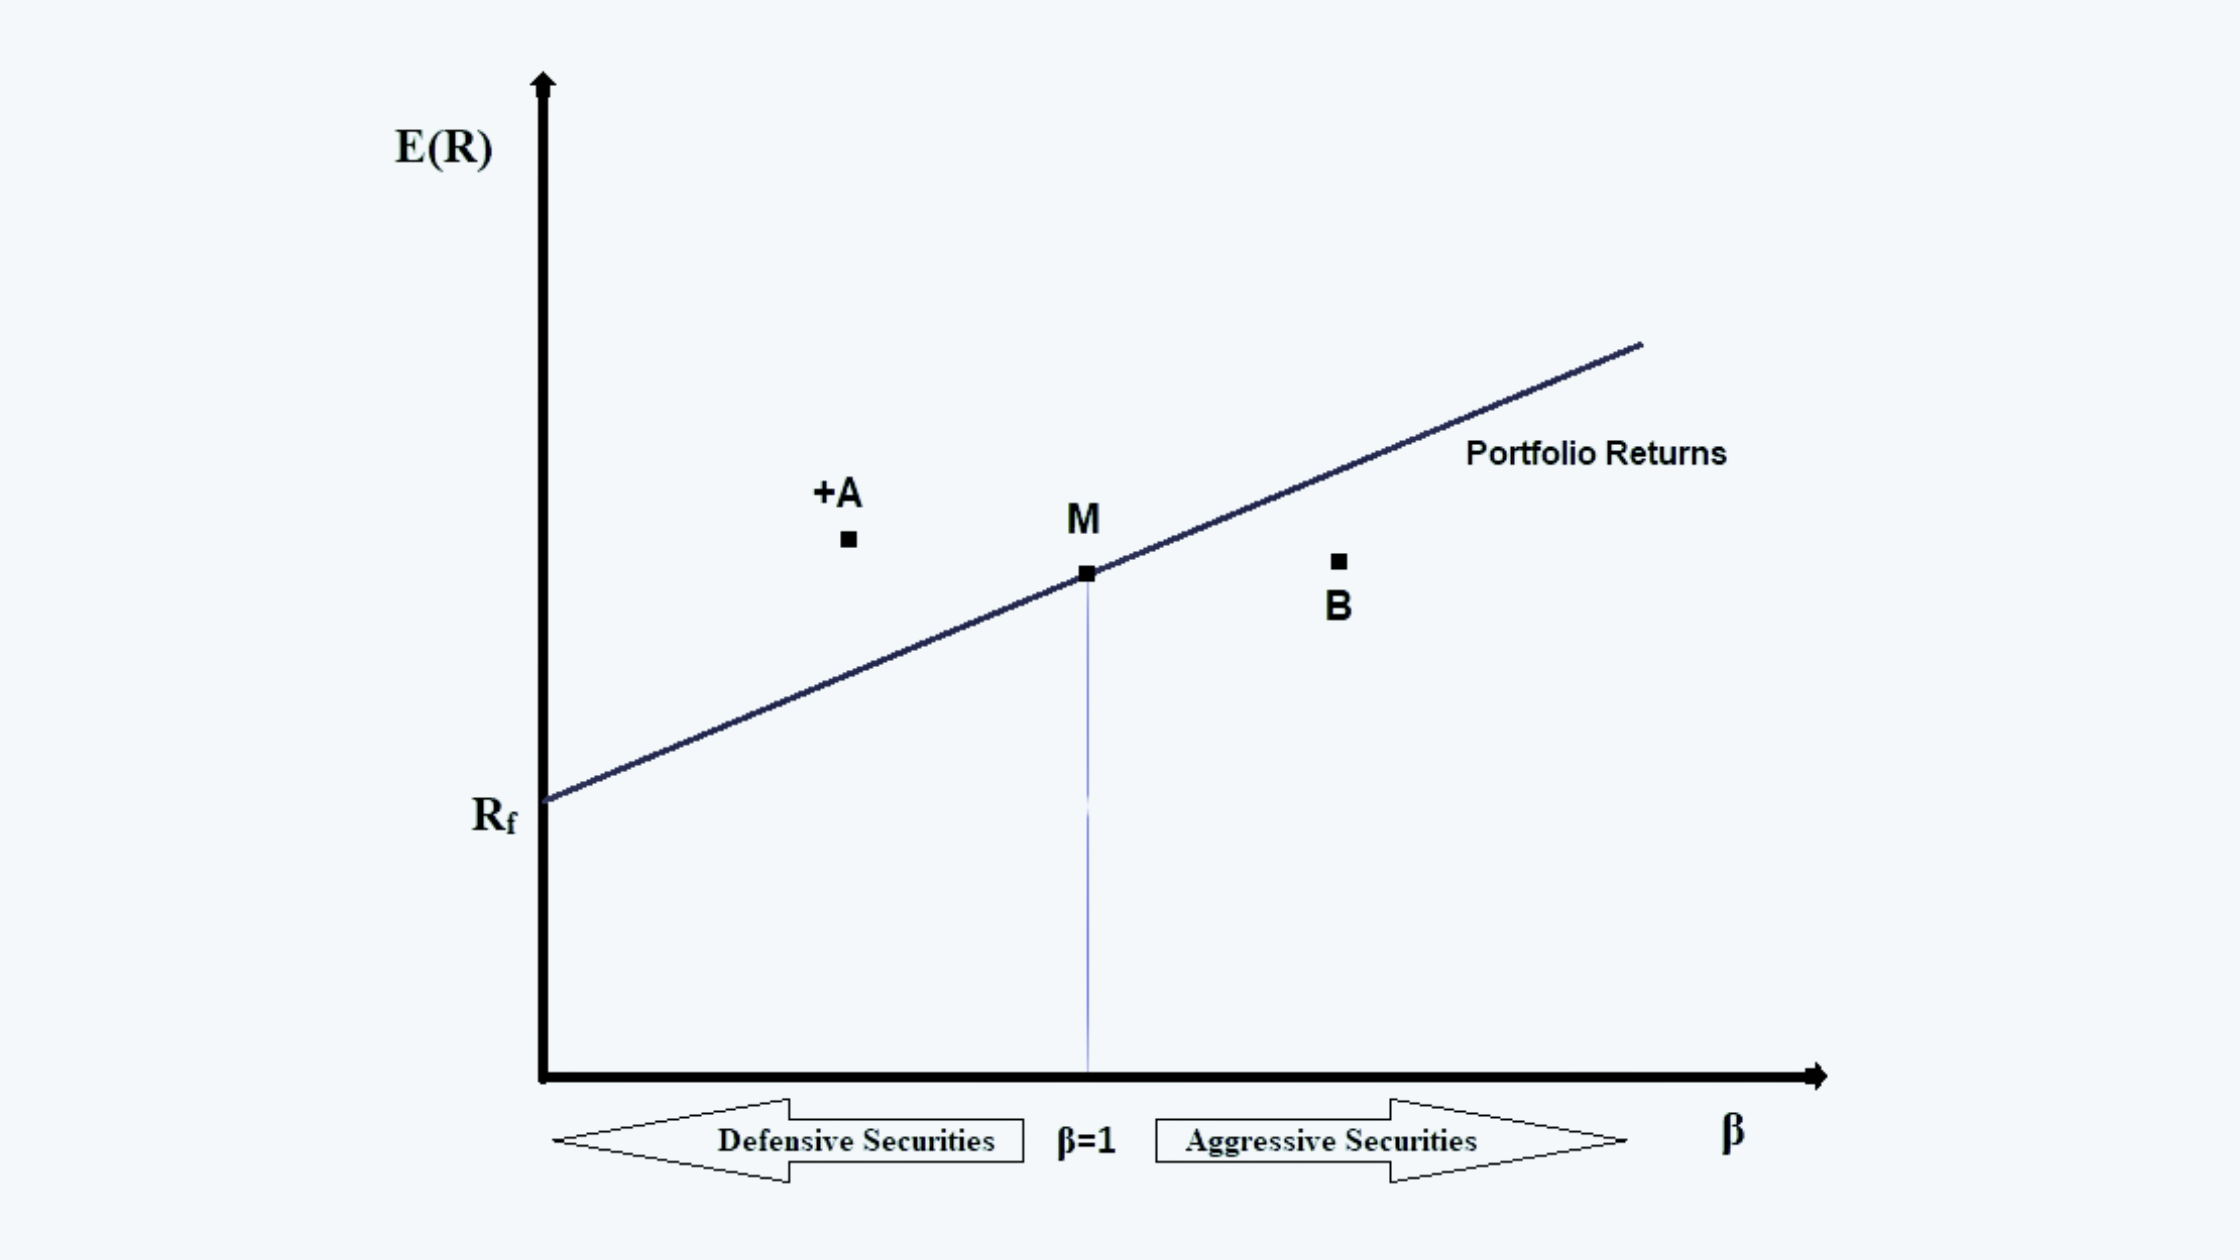
The equation of the SML is:

Security Market Line Portfolio Management CFA level 1 Study Notes

There are two instant interpretations of SML:

a.  Each asset may be viewed as a combination of the risk-free asset and the market

b.  Under equilibrium, all the assets are plotted on the SML i.e., all the assets, which are priced correctly, lie on SML.

Both risk-free rates and the expected return on the market change as the economic conditions change, therefore, the slope of the SML also changes. And, the slope of the SML is equal to the market price of risk.

Beta

a.  If we recall the equation generated in the previous model, the return on a security is calculated as follows:

Ri = α + ꞵRm + ɛi

Where α = (1 – ꞵi) rf, which is a constant.

b.  A measure of systematic risk could be the covariance of security with the market. So, if we take the covariance of the return on security with the market, the equation would be:

Cov(Ri, Rm) = Cov(ꞵiRm + ɛi, Rm)

Since the first term of the above equation i.e. α is constant therefore its covariance would always be zero.

This equation can be expanded as follows:

Cov(Ri, Rm) = Cov(ꞵiRm, Rm) + Cov(ɛi, Rm)

or

Cov(Ri, Rm) = ꞵi Cov(Rm, Rm) + Cov(ɛi, Rm)

Since the covariance of the market with the market is nothing but the market variance, and έi is the standard error, so its covariance with the market is zero; thus, we can write the above equation as:

Cov(Ri, Rm) = ꞵi σm2 + 0

Therefore, from the above equation, we get the value of beta, which is:

Beta Portfolio Management CFA level 1 Study Notes

As we know that Cov(Ri, Rm) = ρim σi σm. Therefore, we can rewrite the above equation as:

Beta Portfolio Management CFA level 1 Study Notes

Or,

Beta Portfolio Management CFA level 1 Study Notes
That was the derivation of beta.

c.  Beta is a measure of how sensitive an asset return is to the market as a whole. It captures an asset’s systematic risk.

d.  The average beta of the stocks in the market is always one. This is mainly because, if we insert the value of markets instead of the securities in the equation of beta, we would get the following:
Beta Portfolio Management CFA level 1 Study Notes

Since the correlation of market with the market is always one, therefore:

m = 1

Also, it has been noticed that most of the securities in the market also have a correlation with stocks greater than 0.70.

e.  We can thus calculate the value of beta, if:

i.  we have an estimate of the standard deviation of the security, i.e.σi,

ii.  we have an estimate of the standard deviation of the market, i.e.σm, and

iii.  we have a value for the correlation between the market return and that of securities.

f.  The one mentioned above was the statistical way of calculating beta. Beta can also be calculated in a simpler way, which is by plotting the combinations of asset’s return and the market returns on a graph, and then drawing a line through all the points such that it minimizes the sum of squared linear deviations from the line, as follows:

Estimating Beta Portfolio Management CFA level 1 Study Notes

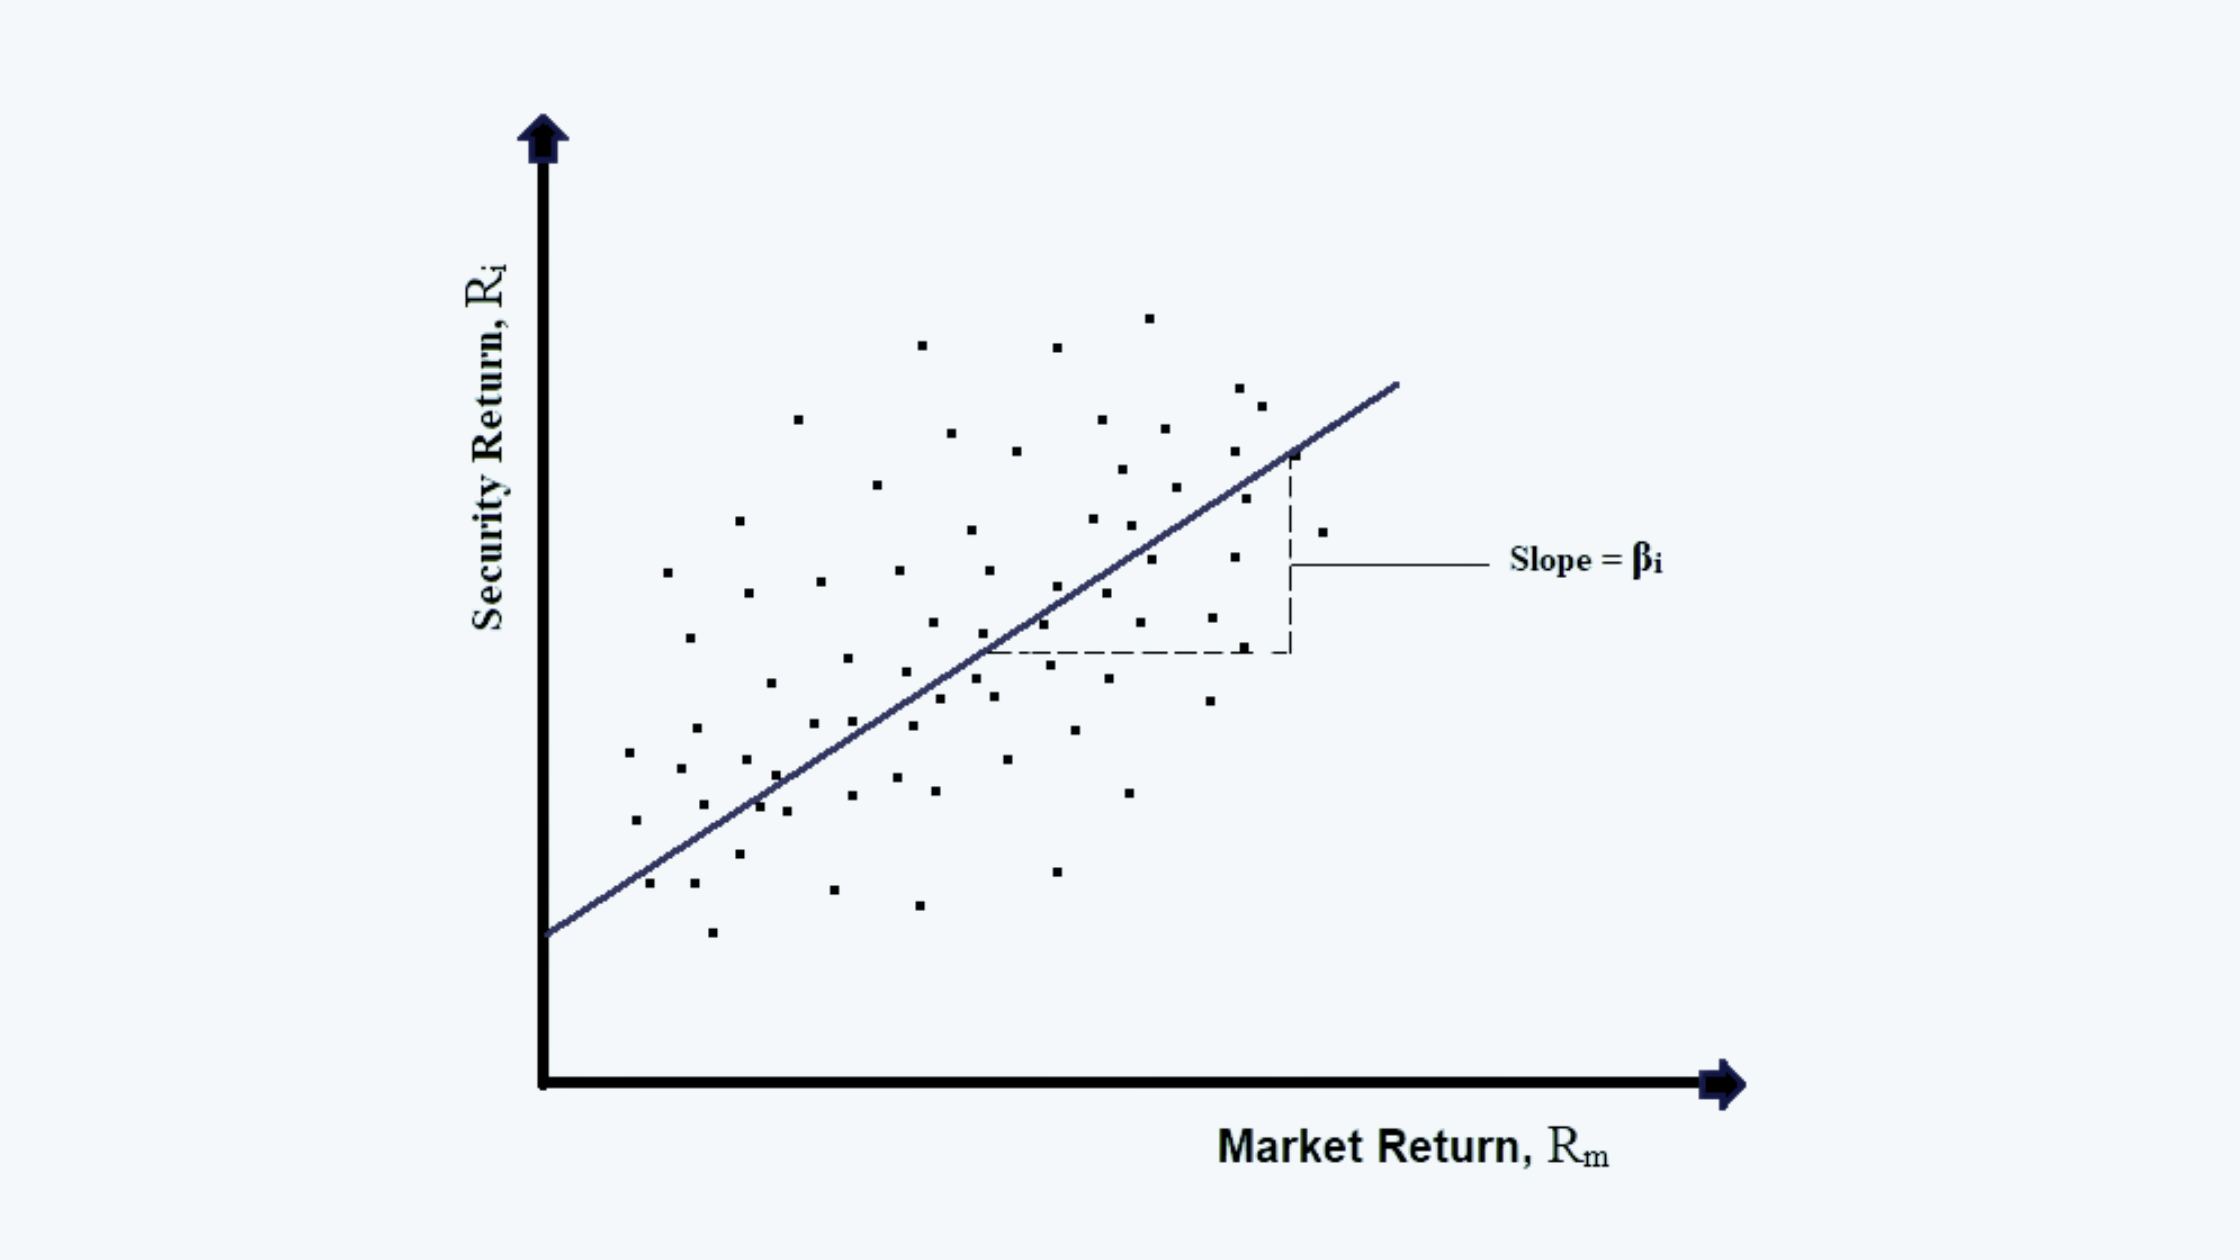
The slope of the line, so drawn is the beta estimate.