LOS E and F require us to:
e. explain the central limit theorem and its importance
f. calculate and interpret the standard error of the sample mean
a. The central limit theorem (CLT) allows us to make precise probability statements about the population mean using the sample mean, regardless of the underlying distribution.
b. Recall, we can estimate the population mean of a random sample by calculating the average value of the sample observations, a statistic is known as the sample mean.
Thus, if σ2 is known,

Or, the mean of the means (i.e. the population mean) is the normal distribution of the population mean (i.e. µ) and the variance of the population divided by the sample size (i.e. σ2/n).
And the standard deviation of this sample distribution is called the standard error, is calculated as follows:

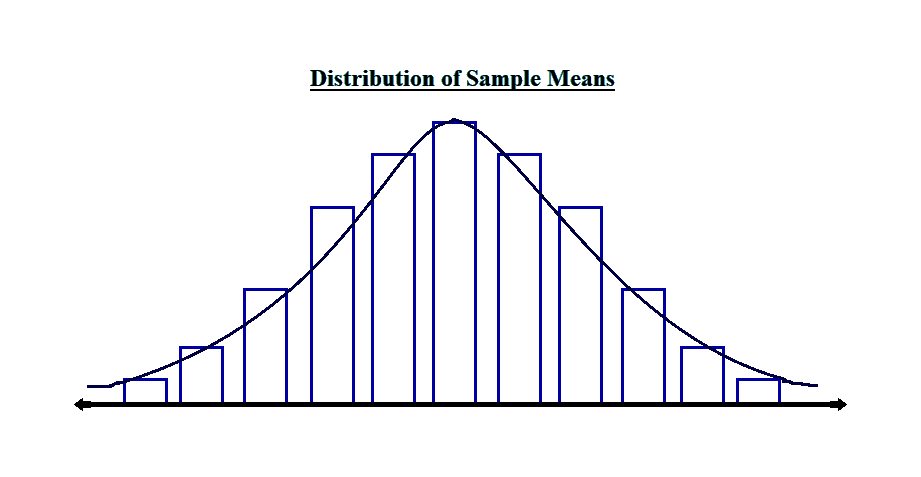
c. Given a population described by any probability distribution having mean µ and finite variance σ2, the sampling distribution of the sample mean, X, computed from samples of size n from this population, will be approximately normal with mean µ (the population mean) and variance σ2/n (the population variance divided by n) when the sample size n is large.
d. We calculate the standard deviation of the sample as follows:

Where the sample variance divided by the number of samples is the estimate of the population’s variance. That is,

e. When the population variance (i.e. σ2) is unknown, we calculate the standard error using the following formula:

f. For example, suppose we have an asset with an average life of 30 years and a standard deviation of 5 years and we have to calculate the standard error for the sample size of 40.
We can do so by calculating the standard deviation of the sample means, as follows:

We can interpret this as follows:
‘With a repeated sampling, we would get a distribution of sample means, such that it is normally distributed with a mean of 30 years and standard deviation of 0.79’. That is,

The above distribution would have a mean of 30 years and a standard error of 0.79.
g. Taking another example of distribution with unknown variance, suppose we have a sample size of 50, having a mean of 5% and a standard deviation of 10%. We have to calculate the error of the mean.
Since we do not have the standard deviation of the population, we would have to do the calculations using the sample data, which would provide us with approximate sample error figures, as follows:

We can interpret the same as follows:
‘With the repeated sampling, we would get a distribution of sample’s mean such that it is a normal distribution with a mean of 0.05 and a standard deviation of 0.0141’.
h. A point to be noted here is that, in the calculation of standard error, we have the square root of sample size in the denominator. Thus, there is an inverse relationship between the sample size and the standard error. Therefore, if the sample size increases, the standard error will decrease.