LOS I requires us to:
calculate and interpret the coefficient of variation
1. Relative Dispersion
a. Relative dispersion refers to the amount of dispersion relative to a reference value or benchmark.
b. The coefficient of relative dispersion shows the amount of variability per unit of its average or target price. The formula for calculating the relative dispersion is:

Here, if mean is the return, CV is the amount of risk per unit of mean return.
c. For example, consider the two frequency distributions and their respective standard deviations as follows:
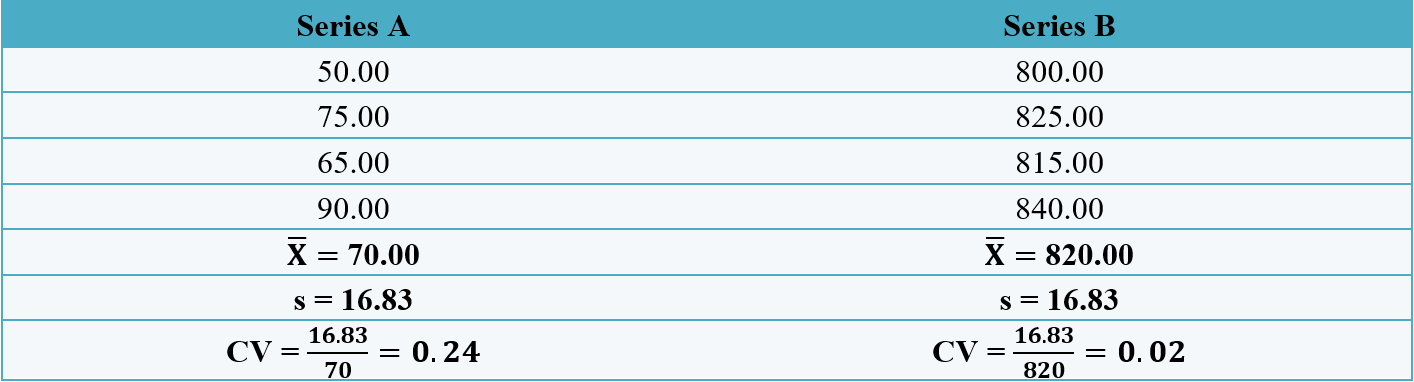
In the above two series, we can see that the standard deviation of both series is 16.83, indicating an equal level of risk. However, the risk of 16.83 looks relatively larger when compared to the series value of series A in comparison to the values in series B. Thus, the comparison of mere values of standard deviation as a measure of risk for the two series is not appropriate. In order to have a more appropriate measure of risk, we calculate the risk relative to its average value, by calculating the relative dispersion. The values of relative dispersion of 0.24 and 0.02, clearly indicate higher risk with series A per unit of average return.
2. Sharpe Ratio
a. Sharpe ratio shows the average excess return on a portfolio, per unit of risk.
b. The formula for calculating the Sharpe ratio is:
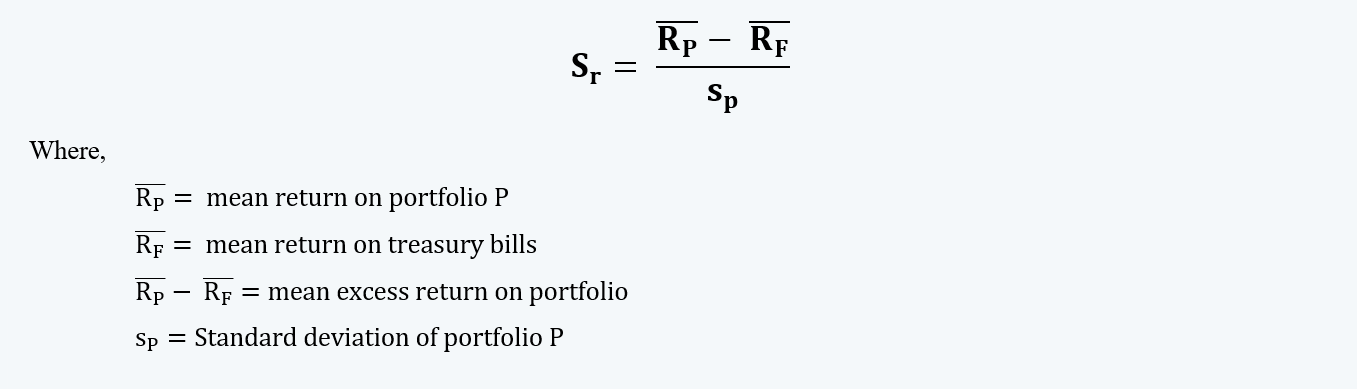
c. Consider the following figure:
In the above figure, we can see that for the same level of risk (i.e. σ), portfolio ‘C’ offers the highest returns. And, all the returns above the risk-free rate are the excess returns. The Sharpe ratio can be calculated by dividing, such excess return by the risk.
d. There are certain conditions to the application of the Sharpe ratio, they are:
i. The Sharpe Ratio should be greater than equal to zero because a negative return per unit of risk is not desirable.
ii. The return distributions are mostly approximately similar, except for some options strategies that sometimes have an asymmetrical distribution.